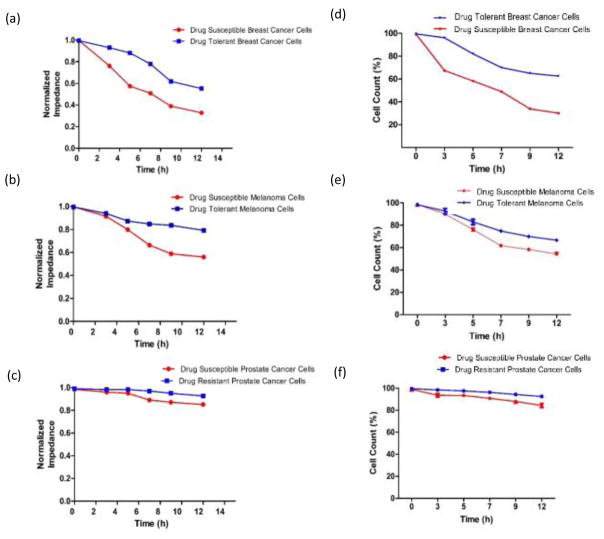
Figure 6. Normalized impedance and cell count results.
(a, b, c) Normalized impedance magnitude for drug-susceptible and tolerant/resistant breast cancer, melanoma, and prostate cancer cells at the drug concentration of 30 μM at 0 h, 3 h, 5 h, 7 h, 9 h, and 12 h time intervals, (d, e, f) Cell viability of drug-susceptible and tolerant/resistant breast cancer, melanoma, and prostate cancer cells after flowing the drug for 0 h, 3 h, 5 h, 7 h, 9 h, and 12 h. The viability was measured by Trypan Blue dye exclusion. Error bars represent standard error of the mean (n=3).

