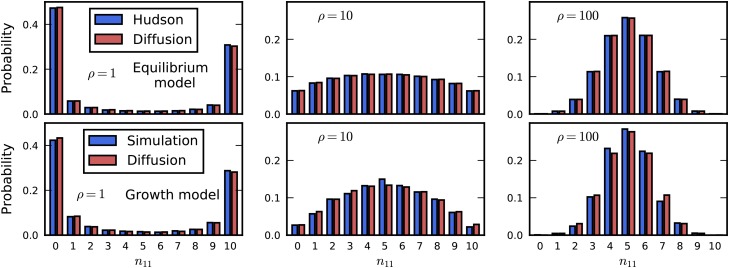
Figure 2.
Verification of numerical solution. For sample size the distribution of is shown, when the frequencies of A and B are and and ρ is varied. Top row: Comparison to equilibrium statistics from Hudson (2001). Bottom row: Comparison to discrete simulation under growth model.

