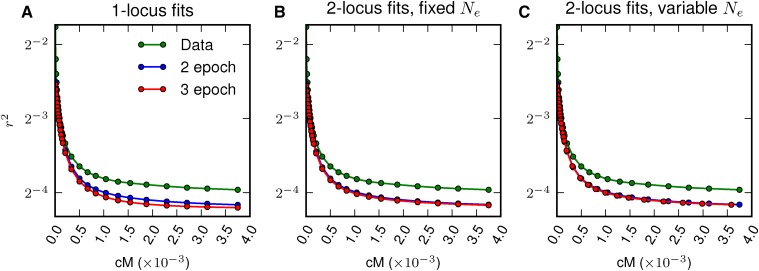
Figure 6.
Fits to LD-decay from Drosophila data. LD-decay curves for two-locus models compared to observed decay curves from the data. (A) The two-locus model using the best fit parameters from single-locus data, (B) the two-locus model fit with set to and (C) the two-locus model with allowed to vary. Each of the models underestimates long-range LD decay, as also observed by Garud and Petrov (2016).

