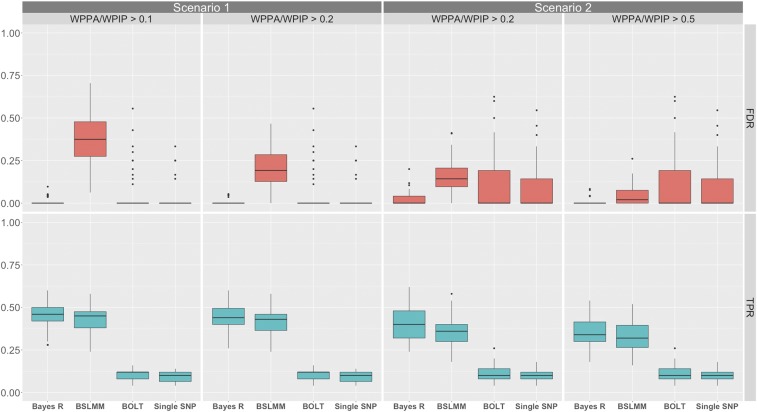
Figure 1.
Comparison of the performance of Bayes R, BSLMM, BOLT-LMM, and single SNP PC corrected association analysis (performed in PLINK) at identifying 1-Mb regions containing causal variants for simulation one, scenarios one and two, which had a simulated PVE equal to 0.9. Panels include method on the x-axis and rate on the y-axis with the true positive rate (TPR) for detecting a 1-Mb region containing a causal variant (cyan), and the false discovery rate (red) for each of the methods. For all panels BOLT-LMM and PLINK P-values are thresholded at the genome-wide significance level () and thus their rates remain fixed across panels. Scenario one (random allocated loci) shows results for Bayes R and BSLMM that have been thresholded on a WPPA or WPIP >0.1 and 0.2. Scenario two (loci associated with ancestry) shows results for Bayes R and BSLMM that have been thresholded on a WPPA and WPIP >0.2 and 0.5. For each scenario, the threshold on WPPA/WPIP was decreased from the initial value (left panel for each scenario) until the median FDR of at least one of either Bayes R of BSLMM was equal to that of BOLT-LMM and single SNP regression. An alternative threshold is also displayed so that the rate of decrease of the median FDR for the other method can be observed.

