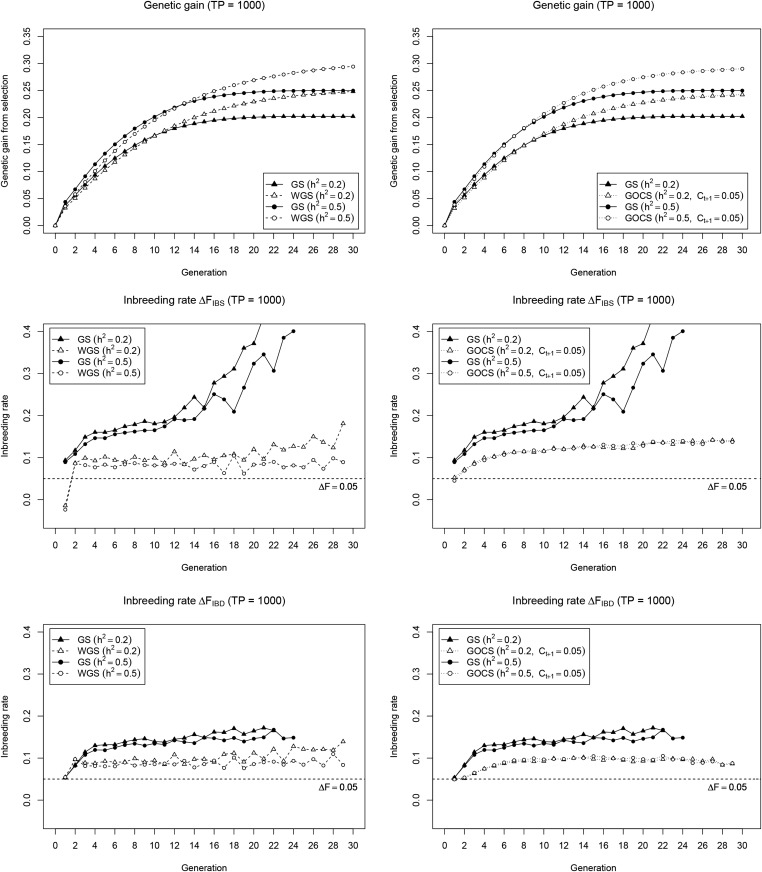
Figure 1.
Cumulative genetic gain (top) and inbreeding rate (IBS: middle; IBD: bottom) for WGS (left) and GOCS (right) as compared to standard GS. Results are reported for a low () and high () heritability, with a large initial TP (= 1000), and are averages of 200 simulation runs. The inbreeding rates are reported until at least half of the simulation runs have lost all variability for the SNP marker panel used.

