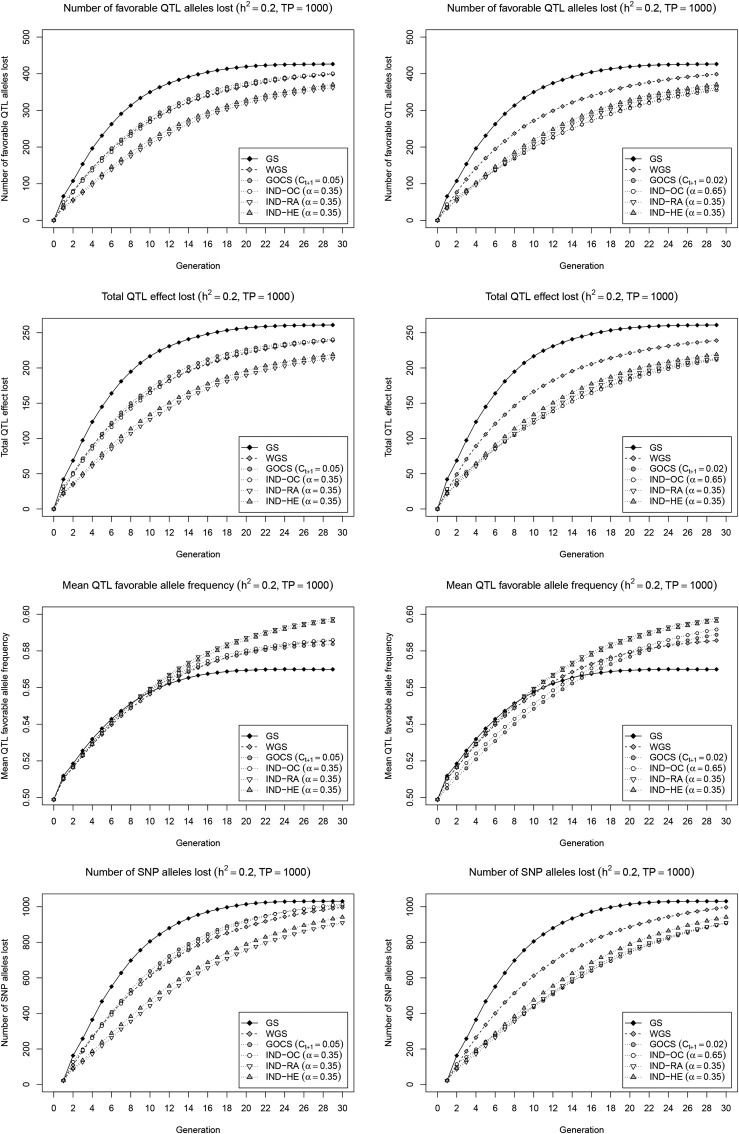
Figure 3.
Favorable QTL and general SNP allele trajectories. Number of favorable QTL alleles lost (first row), total QTL effect lost (second row), mean QTL favorable allele frequency (third row), and number of SNP alleles lost (fourth row) with the simulated selection strategies. Two scenarios were considered to set the parameters and α: maintain the same short-term gain as WGS (left), or achieve a similar inbreeding rate (right). Results are reported for a low heritability () with a large initial TP (= 1000), and are averages of 200 simulation runs.

