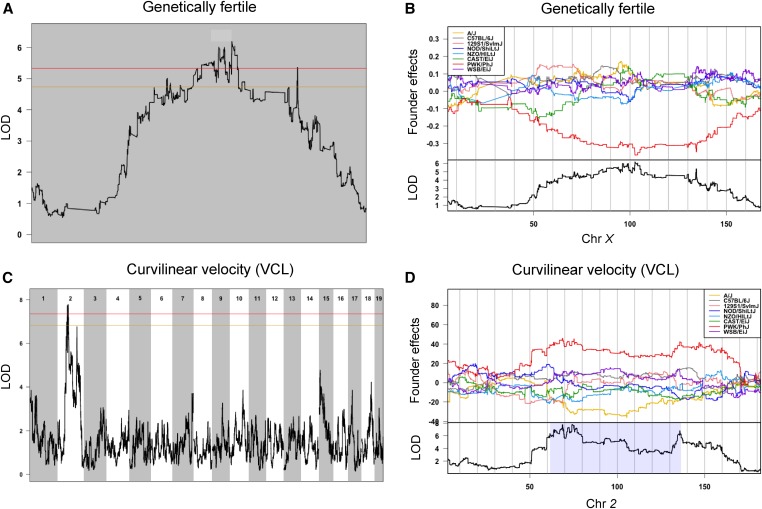
Figure 3.
Selected QTL in CC extinct lines. Chromosomes are ordered across the x-axis with chromosome number labeled at the top. The y-axis is the LOD value. Autosomes and X chromosome were analyzed separately. The red line indicates a genome-wide LOD significance threshold at P = 0.05, the gold line indicates a genome-wide LOD significance threshold at P = 0.10. Light blue boxes indicated the 95% C.I. for QTL. (A) QTL mapping on chromosome X for genetic fertility. (B) Coefficients for CC founder allelic effects of genetic fertility in chromosome X. (C) Genome-wide scan for VCL. (D) Coefficients for CC founder allelic effects of VCL in chromosome 2. CC, Collaborative Cross; VCL, curvilinear velocity.

