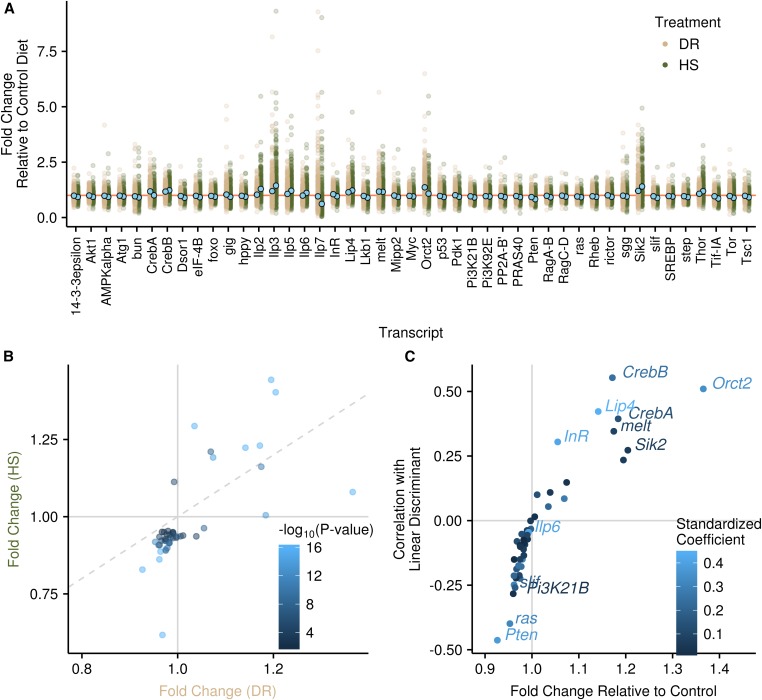
Figure 2.
Phenotypic patterns of gene expression across diets. (A) The fold change in the DR and HS diets relative to the C diet for each gene that was significantly differentially expressed. Each RIX is a single point on the plot. Means are shown with light blue points. The orange horizontal line denotes 1, i.e., no change relative to the control. One outlier point is not shown for Ilp7 in the DR treatment. (B) Comparison between the HS and DR fold change. Horizontal and vertical lines at 1 show when genes are over- or underexpressed relative to the C diet. Diagonal dashed line is the 1:1 line. Points in the quadrants above 1 for one diet and below 1 for the other are genes that trend in different directions in the DR vs. HS diet relative to C (top left and bottom right). Points falling above the 1:1 line in the top-right quadrant and below the 1:1 line in the bottom-left quadrant show a stronger effect in the HS diet than in the DR diet. Points are colored according to their significance. (C) The relationship between each gene’s fold change in the DR diet relative to the C diet and the correlation with the linear discriminant (i.e., loading). Points are colored according to the magnitude of the standardized coefficient from the linear discriminant analysis. Gene names are given for all potentially diagnostic genes (see Materials and Methods). Horizontal and vertical lines demark where genes are over- or underexpressed in the DR diet relative to the C diet.

