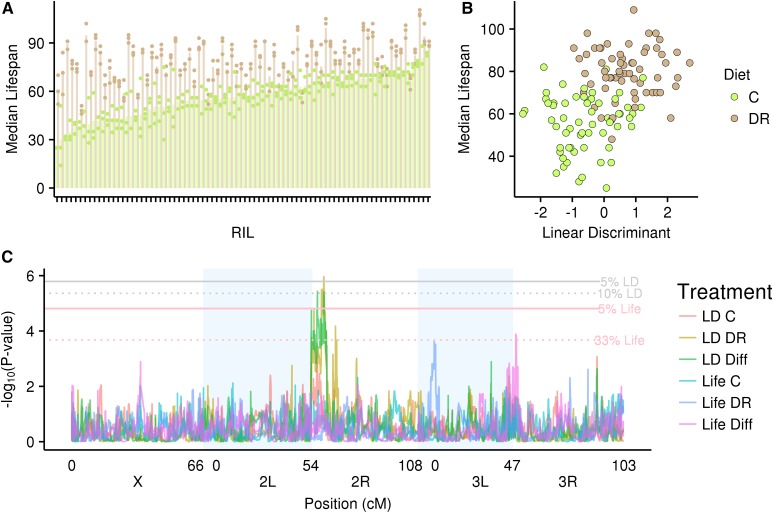
Figure 3.
(A) Median life span for each RIL in each diet. Each pair of bars represents the average median life span in each diet for each RIL. Each point is a single replicate. Different colors denote different diets. (B) Median life span vs. scores on the linear discriminant (LD; gene expression composite). Each point represents the mean for a single RIL/RIX. (C) Genome scans for median life span (1) within the C diet, (2) within the DR diet, and (3) between diets; and for the scores on the linear discriminant (1) within the C diet, (2) within the DR diet, and (3) between diets. Different colors denote the different genome scans. Horizontal lines denote the significance thresholds at different FDR values.

