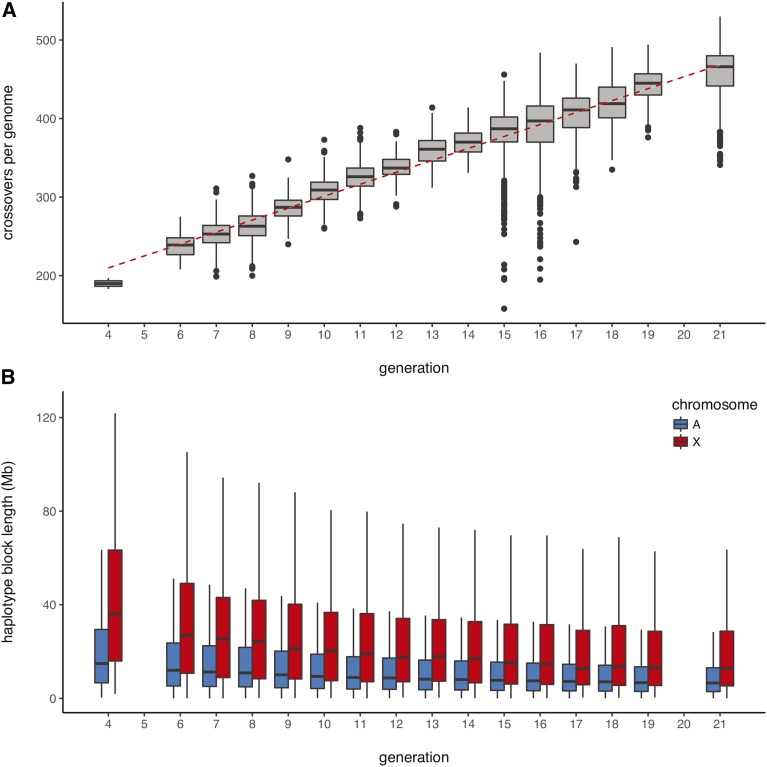
Figure 1.
Accumulation of COs in the genomes of DO mice. (A) Distribution of the number of observed COs per genome as a function of generation number. The accumulation of COs is linear (regression line shown in red), with rate 15.2 ( CI ) additional autosomal COs per genome per generation. (B) Distribution of haplotype block lengths by generation.

