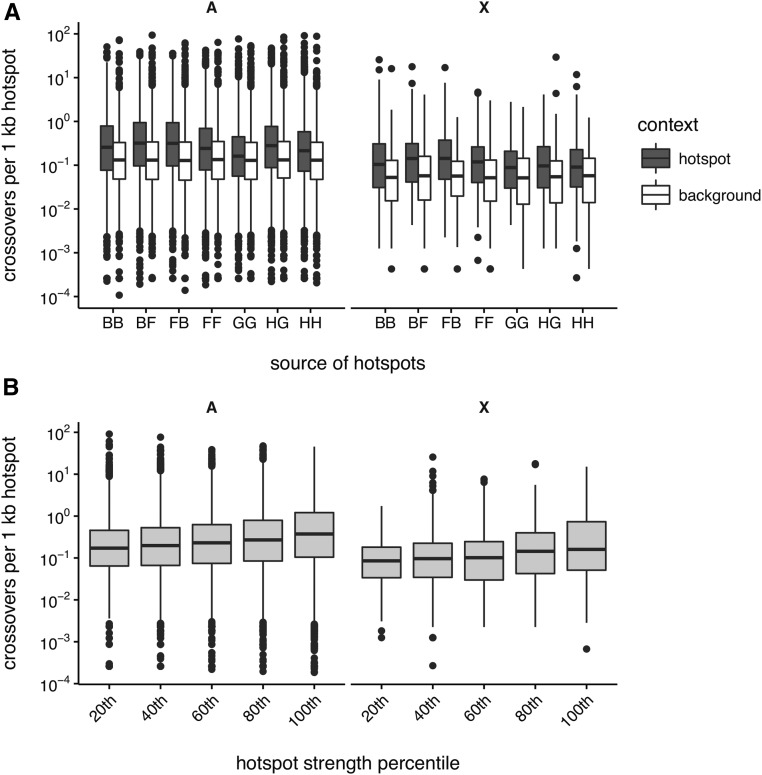
Figure 3.
Recombination hotspot usage in the DO. (A) Distribution of CO density in hotspots defined by H3K4me3 ChIP-seq in testes from several genotypes, vs. random genomic intervals of equal size. Crosses are denoted as (maternal strain) × (paternal strain), and strains denoted by their one-letter codes: B = C57BL/6J, F = CAST/EiJ, G = PWD/PhJ, H = WSB/EiJ. (B) Distribution of within-hotspot CO density by bins of hotspot strength, denoted by their right endpoint. Overlap is computed separately for the autosomes (A, right) and X chromosome (X, left).

