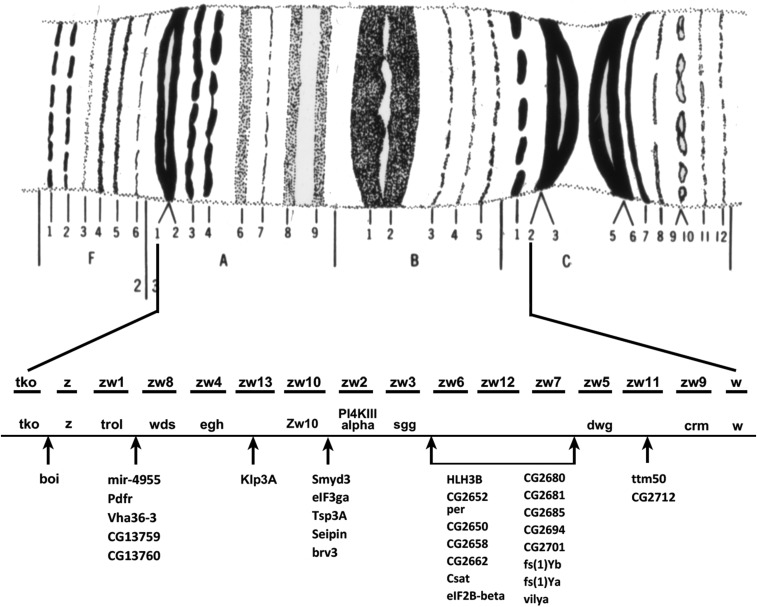
Figure 7.
Genetic saturation map of the zeste – white interval on the X chromosome. The banding pattern of the 3A1,2–3C2,3 is shown at the top. Using zeste in 3A2 and white in 3C2 as left and right positions, this interval contains 14 polytene bands on Bridges’ map. The first line below the map shows the names and order of the lethal loci identified in saturation screens. The next line shows the positions and identity of genes mapped at the molecular level, which are known alleles of the original genetically identified lethals. The lists below are genes known from the molecular annotation of this interval with arrows indicating their positions relative to the genetic map. Note that there are many more molecularly defined loci than have genetically identified lesions. In addition to the loci listed in this figure, there are ∼30 additional mutations provisionally assigned to this interval whose allelic relationship to either the molecularly or genetically identified loci has yet to be determined. After Judd et al. (1972).

