
Figure 4.
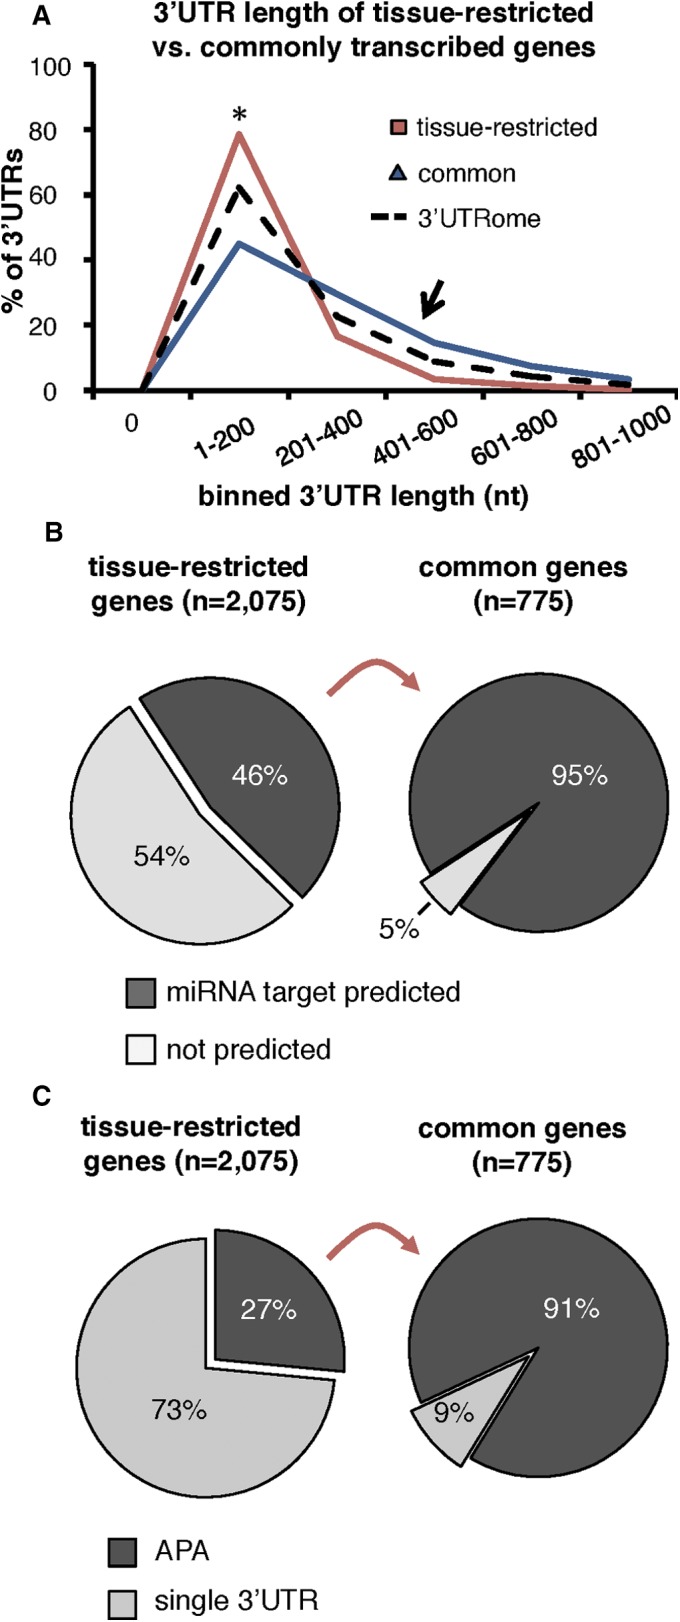
Commonly transcribed genes are enriched in APA and miRNA targets. (A) Histogram comparing the length distribution of 3′UTRs of tissue-restricted (red) and commonly transcribed genes (blue) with the C. elegans 3′UTRome (dotted black). Commonly transcribed genes have longer 3′UTRs, on average. (B) Portion of commonly transcribed or tissue-restricted genes with at least one PicTar or mirANDA predicted miRNA target in their 3′UTRs. Most commonly transcribed genes have at least one predicted miRNA target. (C) Pie charts displaying the proportion of tissue-restricted genes (left chart) or commonly transcribed genes (right chart) with >1 3′UTR isoform (APA). Nearly all commonly transcribed genes are prepared with at least two 3′UTR isoforms.