Figure 6.
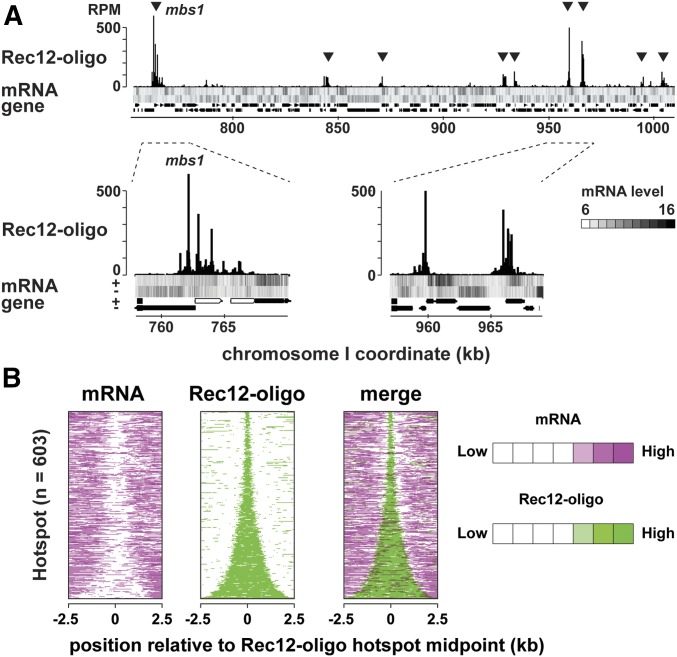
Correlation between transcription and recombination initiation sites around fission yeast hotspots. (A) An example of uniquely mapped Rec12-oligo and complementary DNA of meiotic transcripts hybridized to genome tiling array. The x-axis shows the chromosomal coordinates in base pairs, and the y-axis shows reads per million base pairs (RPM). The heat map shows the log2 signal strength of forward and reverse transcripts. Black and white represent up- or downregulation of gene expression. Protein-coding genes and RNA genes are shown as filled black and gray boxes at the bottom of the figure, respectively. Two regions are zoomed to show the locations of Rec12-oligo and transcripts within hotspots. (B) Heat maps of transcripts (left) and Rec12-oligo (middle) around hotspots. All hotspots on the genome (n = 603) were ranked by width and their midpoints were aligned. Data of transcripts (magenta) and Rec12-oligo (green) were overlaid to show on a color scale (right). Magenta and green represent high signals, while white represents low signals.

