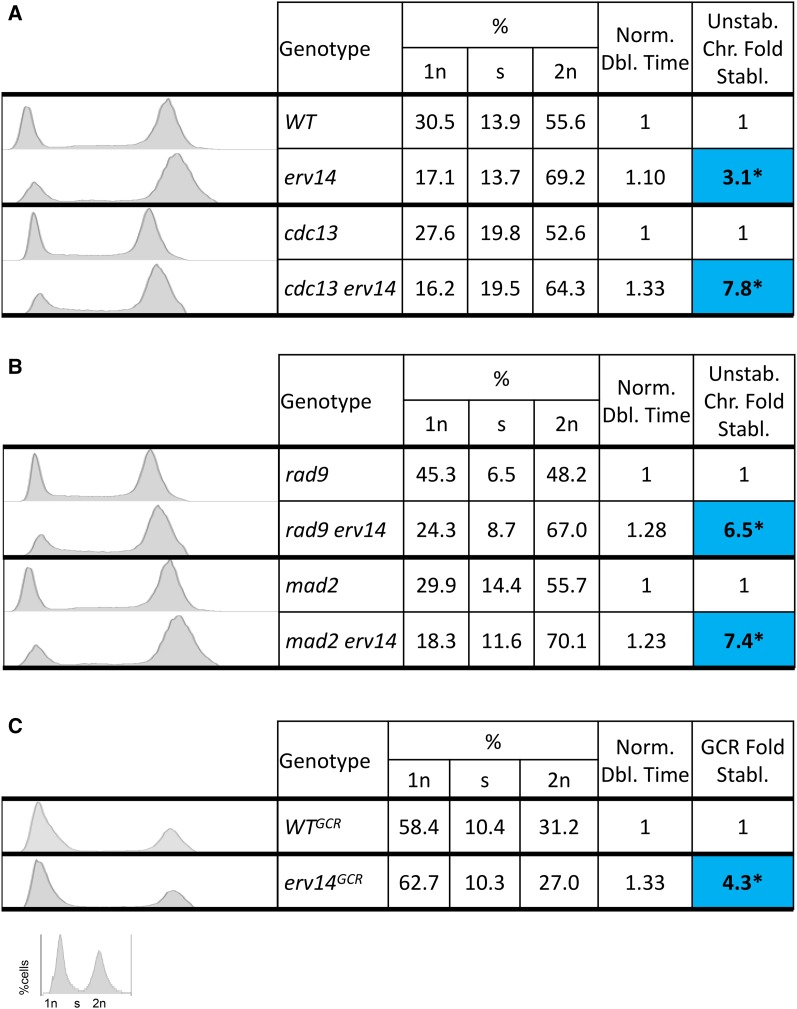
Figure 4.
DNA content FACS analysis and nuclear profiling. (A) DNA content FACS analysis of checkpoint-proficient, WT and cdc13 cells with their erv14−counterparts. Also shown are corresponding doubling times and genome fold stabilization. (B) DNA content FACS analysis of checkpoint-deficient cells rad9Δ and mad2Δ with their erv14− counterparts. Also shown are corresponding doubling times and genome fold stabilization. (C) DNA content FACS analysis of WTGCR with its erv14− counterpart. Also shown are corresponding doubling times and genome fold stabilization. *Statistically significant P < 0.01 using Kruskal–Wallis test.

