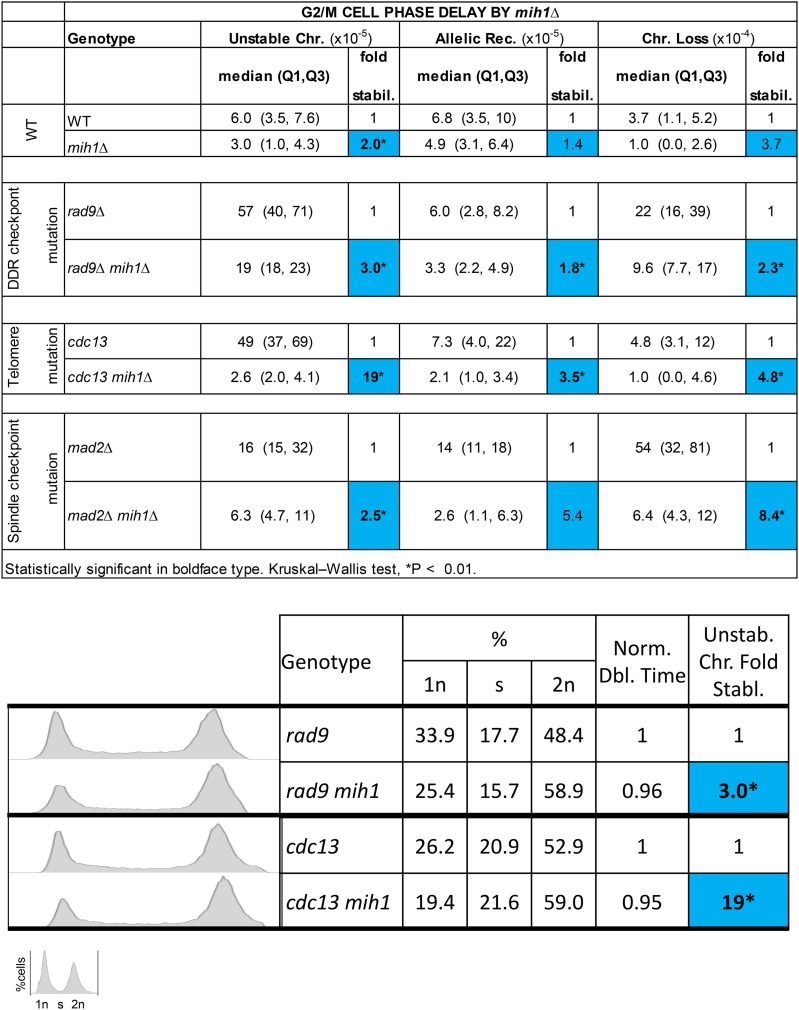
Figure 5.
G2/M phase delay by mih1Δ. Instability table of checkpoint-proficient and -deficient cells and their mih1Δ counterparts. DNA content FACS analysis of checkpoint-deficient and -proficient rad9Δ and cdc13 cells with their mih1− counterparts. Also shown are corresponding doubling times and genome fold stabilization. Blue and red squares correspond to genome fold stabilization increase or genome fold stabilization decrease (<1.0 = increased instability), respectively. *Statistically significant P < 0.01 using Kruskal–Wallis test.

