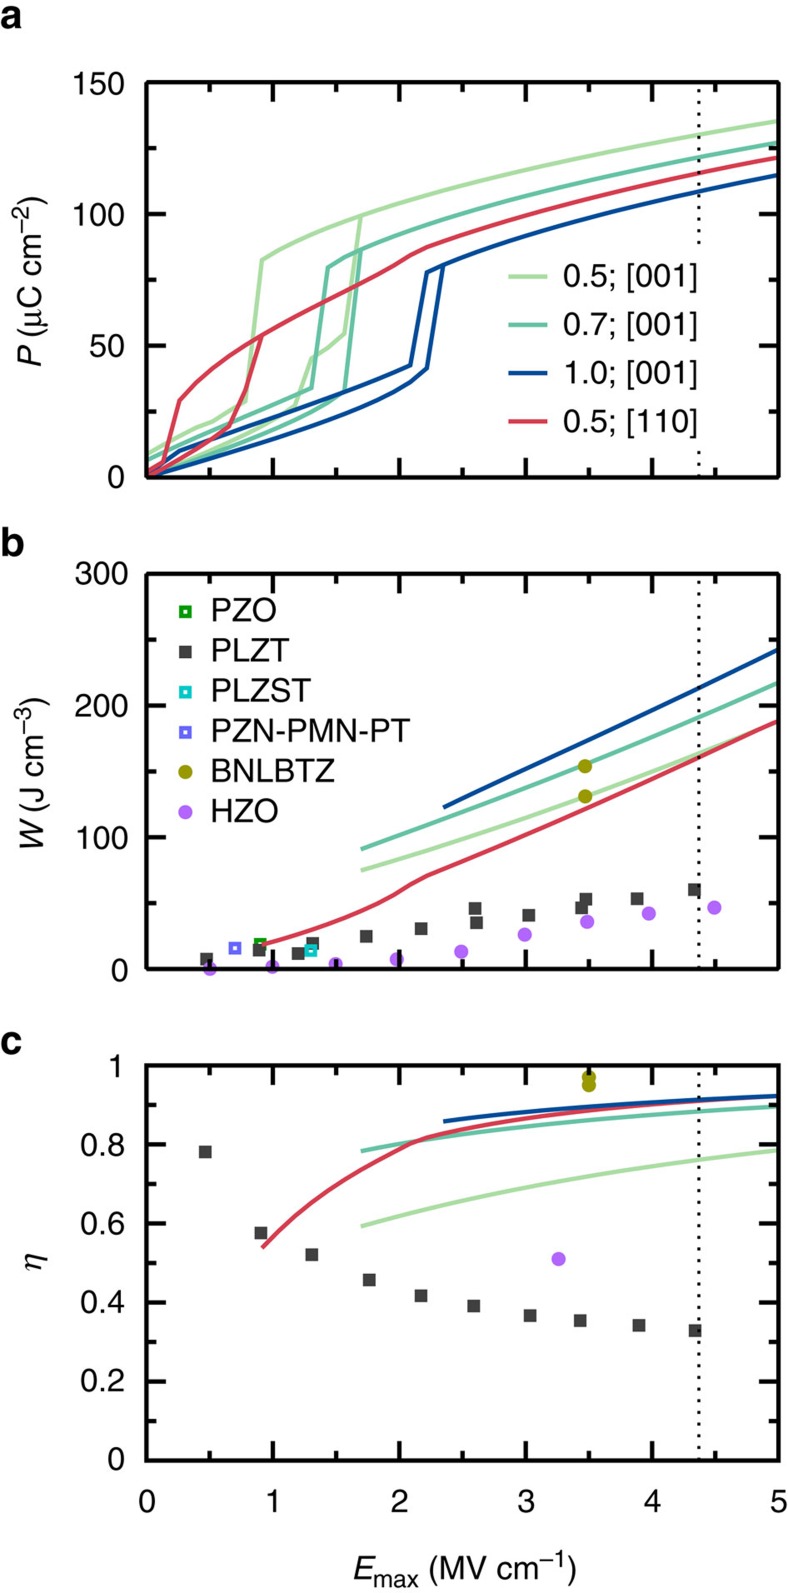
Figure 5. The computed energy storage performance of selected Bi1−xNdxFeO3 solid solutions.
(a) The P–E hysteresis curves. (b) The energy density as a function of the magnitude of the maximum applied electric field, with the discrete symbols representing the best available experimental data from different types of materials, that is, lead-based (PbZrO3 (PZO)34, PLZT5,6,35,44, (Pb,La)(Zr,Sn,Ti)O3 (PLZST)33 and Pb(Zn1/3Nb2/3)O3-Pb(Mg1/3Nb2/3)O3-PbTiO3 (PZN-PMN-PT)33), and lead-free (BNLBTZ10 and HZO11) systems. (c) The efficiency as a function of the magnitude of the maximum applied electric field. The dotted vertical line denotes the estimated intrinsic breakdown field for BFO30,31.

