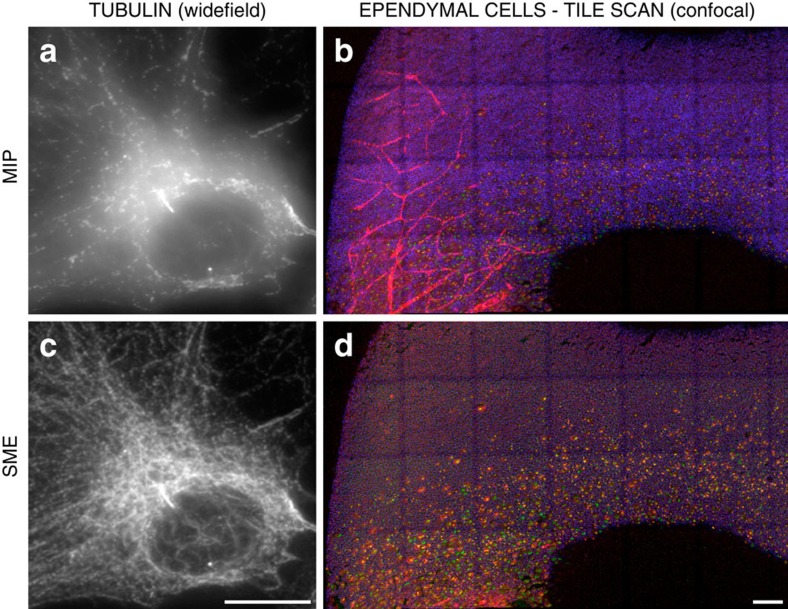
Figure 1. Motivation to preserve spatial consistency within one channel and between channels.
(a,c) An image stack of the immuno-stained tubulin network in a single cell from a study on the formation of tyrosinated tubulin. The stack was imaged by a conventional wide-field microscope and rendered with (a) MIP and with (c) SME. By selecting a continuous layer of voxels, SME discards the aggregation of irrelevant signal located nearby in the x/y direction albeit far apart in the z direction. A consequence of this selection is an important increase of contrast that enabled distinguishing clearly individual tubulin filaments when compared to the popular MIP approach. Scale bar, 10 μm. (b,d) Whole-mounted view of a tile scan of ependymal cells from the lateral ventricular surface of a P1 Centrin2gfp transgenic mouse (GFP, green), double immuno-stained with a cell junction marker (βCatenin, blue) and a marker for nascent centriole (Sas6, red). For this developmental study of the apical surface, the tissue sample is imaged as multiple stacks stitched together to form a 3D image of 3,929 × 9,307 × 58 voxels. The apical surface being not planar, it was impossible to avoid imaging (in red channel) the blood vessels targeted by the same antibody used for staining nascent centrioles. Consequently, (b) MIP, by extracting high-intensity voxels, captures a mix of blood vessels located below the apical surface and of nascent centrioles, which makes any further analysis or even visual inspection difficult. (d) SME, by using the cell junction marker channel (blue) as reference, clearly discards the blood vessels that were located below the apical layer, which allow nascent centrioles to be clearly distinguished. Scale bar, 100 μm. A crop of this large slide is presented with more details in Fig. 4d,e. Each data set is further described in Supplementary Table 1.

