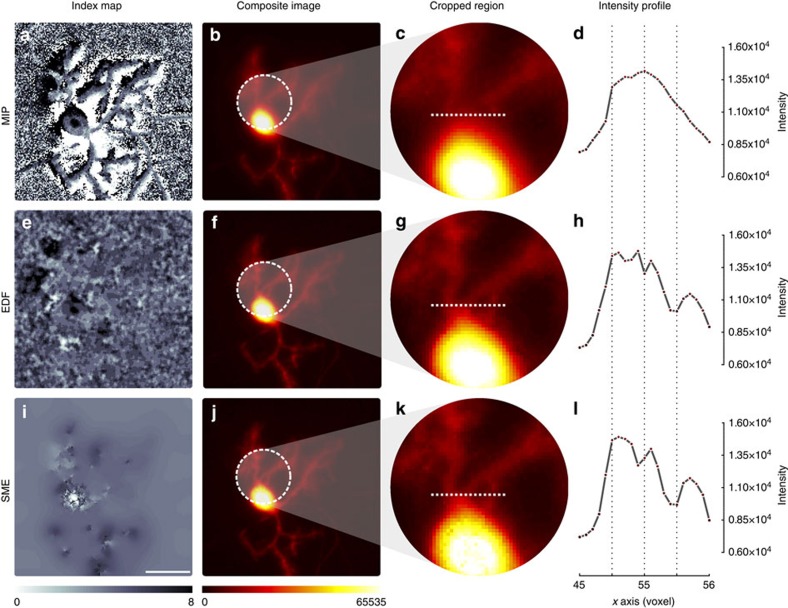
Figure 3. Preserving spatial consistency maintains image resolution.
We compare the results obtained by MIP, EDF9 and SME on an image stack of a Purkinje cell in 8 days old cerebellar mixed culture acquired by wide-field epifluorescence microscopy to quantify dendritic morphogenesis. The index maps in the first column (a,e,i) show for each pixel (x,y) the levels in the stack (0–8) from which the corresponding intensity values were extracted to obtain the 2D projection in the second column (b,f,j). Scale bar, 10 μm. The index of MIP shows that two neighbouring pixels can originate from the top and the bottom of the stack and therefore can artificially bring together objects far apart in the 3D volume. EDF, by applying the same local smoothing operator on the index map, reduces this effect but fails to produce a fully continuous index map on the background to preserve foreground details. SME constrains the background to reach the foreground level locally but smooths the foreground much more slightly to preserves details. Zoomed view in column 3 (c,g,k) and intensity profiles in column 4 (d,h,l) show that precision is improved to recover fine details. In this example, the three intensity peaks obtained by SME (l) shows a more accurate dendrite quantification by SME, where d,h could lead to erroneous profiles. This data set named NEURON1 is further described in Supplementary Table 1.

