Fig. 2.

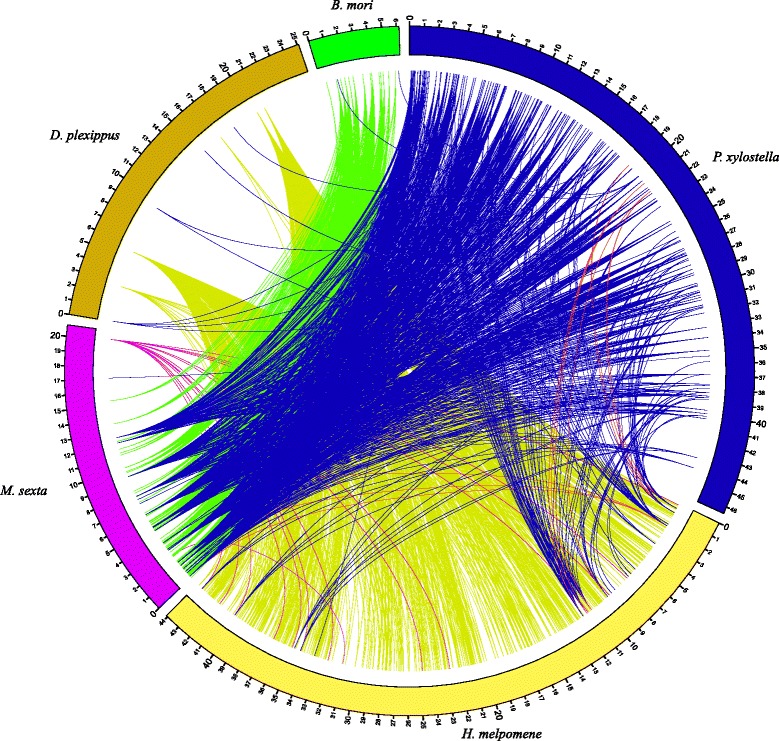
Duplication map comparison of five Lepidoptera species. SDs regions in each Lepidoptera species and their paralogous regions in other four genomes were shown. Different colors represent different insects. Only the best alignments were listed

Duplication map comparison of five Lepidoptera species. SDs regions in each Lepidoptera species and their paralogous regions in other four genomes were shown. Different colors represent different insects. Only the best alignments were listed