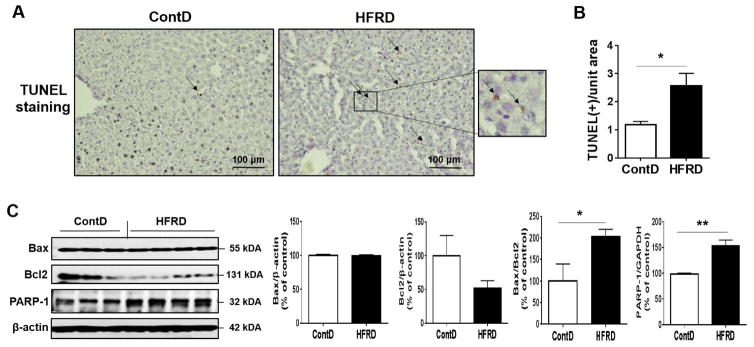
Figure 7.
Effects of HFRD on hepatic apoptosis. (A) Representative images of TUNEL- positive apoptotic hepatocytes (marked with black arrows) in the livers of indicated groups are presented. (B) Number of TUNEL-positive hepatocyte in 10 high-powered fields (×200) was calculated. (C) Representative images and densitometric levels of the immunoblot analysis for Bax, Bcl2, and PARP-1 in the livers of the experimental groups. All results are presented as mean ± S.E.M. (n=6~7/group). Significant differences between the two groups are indicated by asterisks: *P < 0.05; **P < 0.01.

