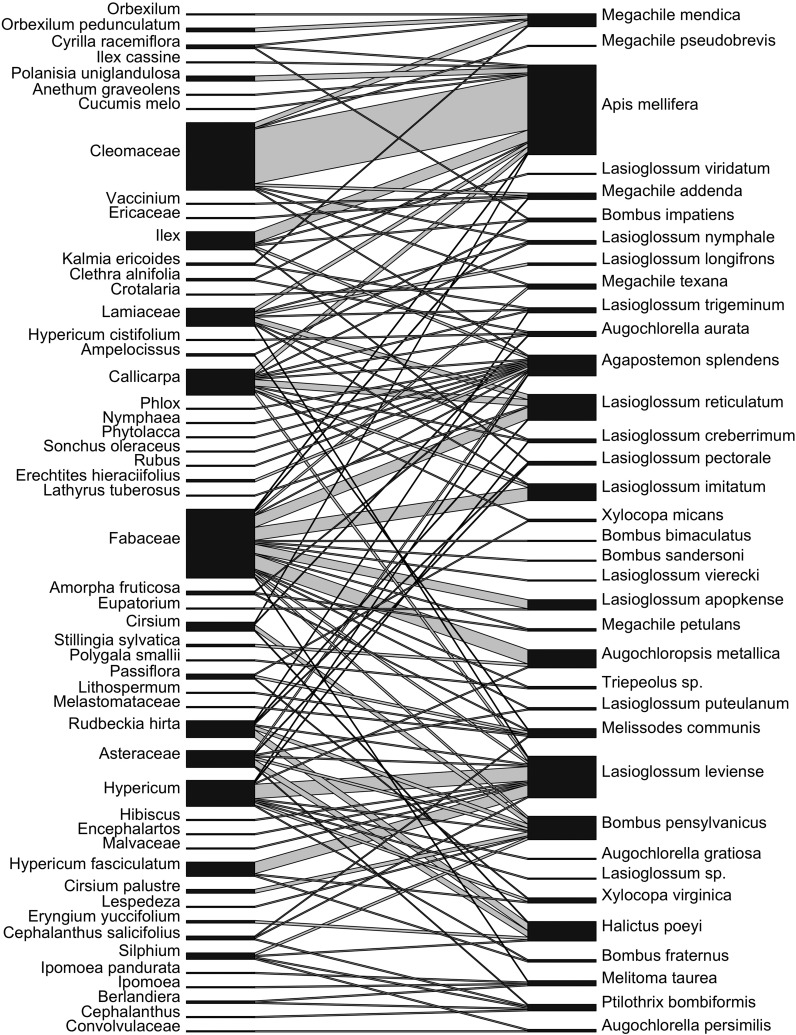
Fig. 3.
Bipartite pollination network of 37 bee specimens (top nodes) to the 51 plant taxa present in their pollen loads based on ITS2 taxonomic classification (bottom nodes). Interactions were pooled within plant and bee taxa. Links between plants and pollinators are represented with lines whose width is proportional to the number of interactions while the width of the nodes represents total abundance of that taxon across all of its interactions.

