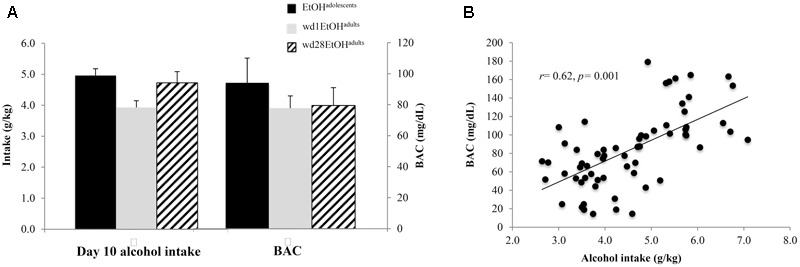
FIGURE 2.

Day 10 BAC sampling. (A) Average alcohol intake and BAC by group, averaged across both behavioral testing and immunoblotting animals (n = 21/group). (B) Alcohol intake was significant correlated with BAC. Data depict all alcohol-drinking animals (n = 63).
