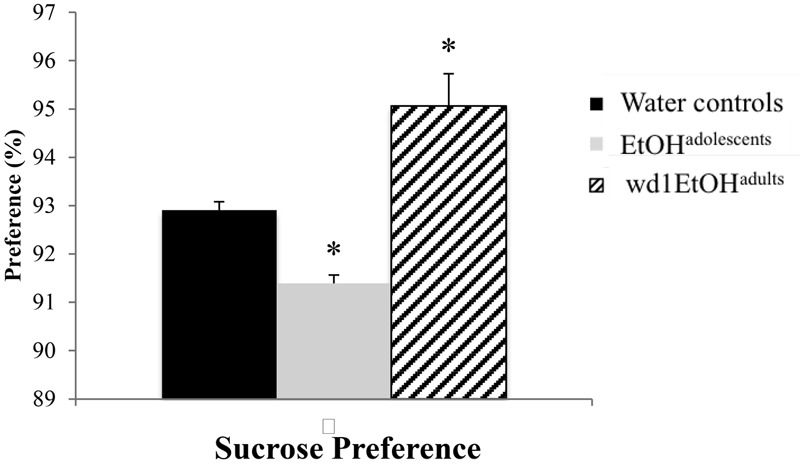
FIGURE 3.

Altered sucrose preference following alcohol drinking. EtOHadolescents showed significantly reduced sucrose preference compared to water control animals while wd1EtOHadults showed increased preference. ∗p < 0.05 vs. water controls. Data represent mean + SEM, n = 9/group.
