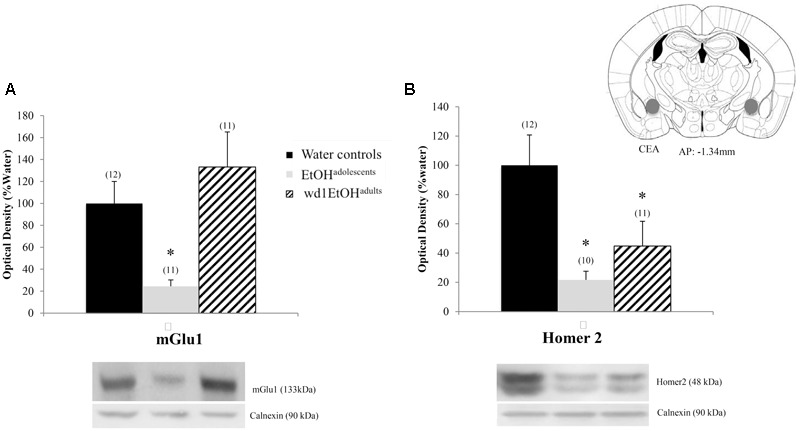
FIGURE 8.

Alcohol-induced decreases in glutamate-related protein expression within the CeA. (A) EtOHadolescents, but not wd1EtOHadults, showed a significant decrease in mGlu1 expression within the CeA. (B) Both EtOHadolescent and wd1EtOHadults showed a significant decrease in homer 2 expression ∗p < 0.05 vs. water controls. Data represent mean + SEM of the number of animals indicated in parentheses.
