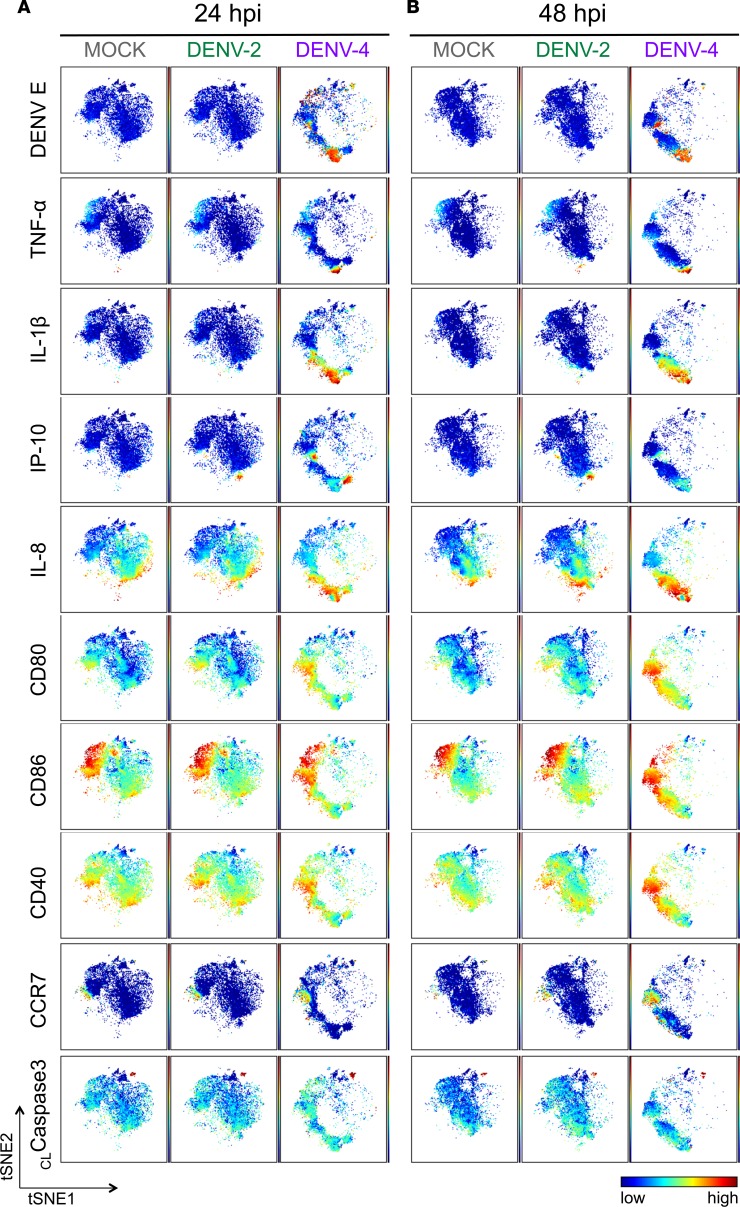
Figure 3. The phenotypic landscape is different during DENV-2 versus DENV-4 infection in DCs.
Live single CD45+ cells from representative donor 2 (Supplemental Figure 3B) of the 7 DC donors were used to create viSNE plots, which were generated using all 18 phenotypic markers used for mass cytometry by time-of-flight (CyTOF) staining except markers for dengue virus (DENV). Each point in the plot represents a single cell, and the axes show arbitrary units based on the t-distributed stochastic neighbor embedding (t-SNE) algorithm. The relative position of a cell on the plot represents its general phenotype in multidimensional space. For (A) 24 hours after infection (hpi) and (B) 48 hpi, cells are colored according to staining intensity of the indicated marker, enabling the comparison of expression patterns across markers for different infection conditions and time points after infection.

