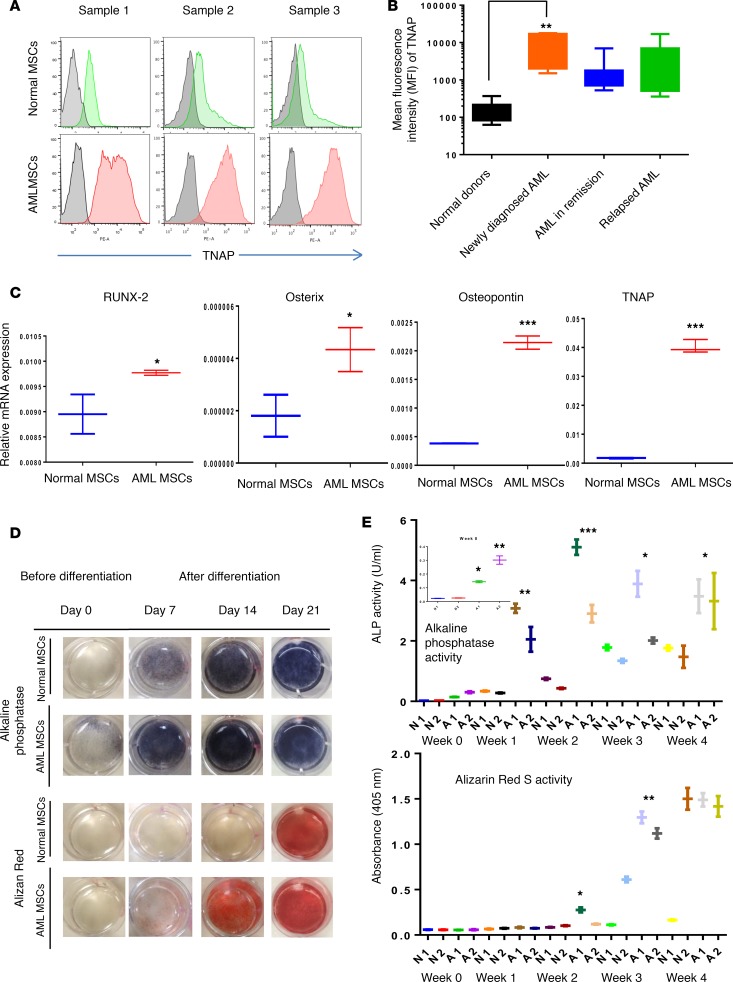
Figure 1. Acute myeloid bone marrow–derived mesenchymal stromal cells are primed to differentiate into osteoblasts.
(A) Tissue nonspecific alkaline phosphatase (TNAP) expression was analyzed by flow cytometry on normal donor–derived (Normal-MSCs) (green) or acute myeloid bone marrow–derived mesenchymal stromal cells (AML-MSCs) (red) over unstained cells (gray). Cells were incubated with anti-TNAP antibody (clone W8B2) conjugated with phycoerythrin (PE). The TNAP-stained cells were overlaid on unstained cells; representative histograms (n = 3 for each cell type) are shown. Data were analyzed by FlowJo software. (B) MFI of normal MSCs (N-MSCs) (n = 11) or AML-MSCs (n = 29) stained with TNAP antibody were determined. AML samples with different disease status, including newly diagnosed (n = 6) or remission (n = 8) or relapsed (n = 15), were graphed separately. (C) mRNA expression of osteoprogenitor-associated genes, RUNX2, osterix, osteopontin, and TNAP, in N- and AML-MSCs was measured by qRT-PCR. GAPDH served as an equal loading control. (D) Alkaline phosphatase activity was determined by an enzyme assay in N- and AML-MSCs (n = 3 for each) cultured in the presence or absence of osteogenic differentiation medium for 3 weeks. At the end of each week (days 7, 14, and 21), the cells were incubated with FAST BCIP/NBT substrate or Alizarin Red S stain and images acquired. (E) Alkaline phosphatase enzyme activity and absorbance at 405 nm for Alizarin Red S staining were quantitated as described in the methods section. Statistical data were analyzed by GraphPad Prism software. One-way ANOVA was used for comparison of 3 or more groups and unpaired Student’s t test was used for comparisons of 2 groups. (*P < 0.05, **P < 0.01, ***P < 0.001 versus control). Dunnett’s multiple comparison test was used to check the statistical significance in difference between multiple groups.

