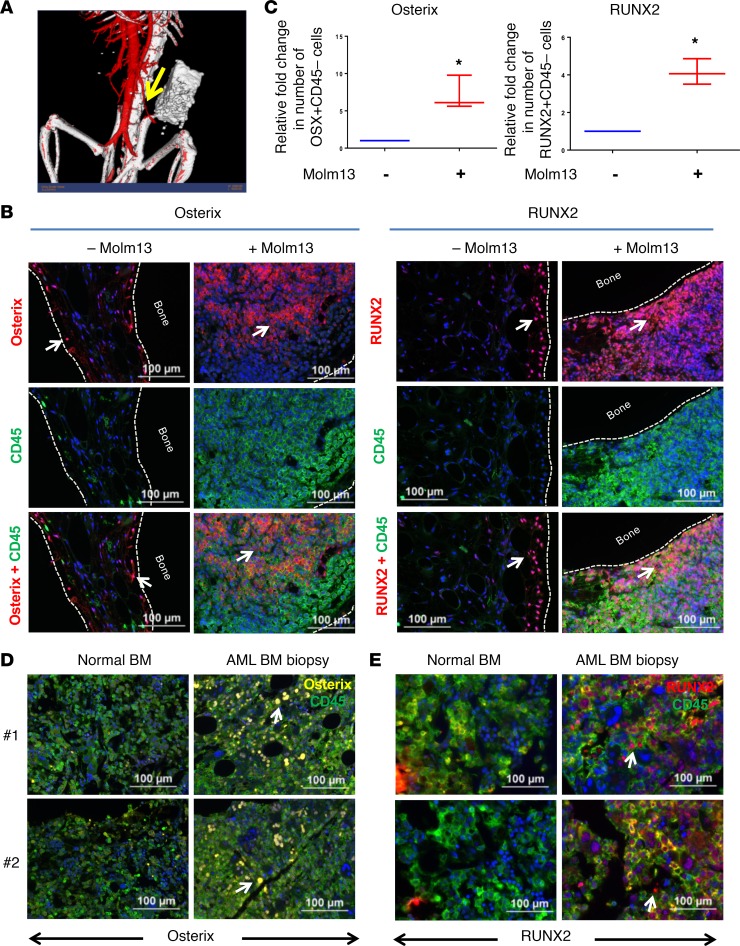
Figure 4. Human bone marrow implant model and patient AML-BM biopsy specimens validate AML-induced osteogenic differentiation in vivo.
(A) Human femur–derived bone fragments were transplanted with Matrigel into the right flanks of NSG mice. Four weeks after implantation, vascularization of the HBMI bone fragments was confirmed by X-RAD 225 Cx cone-beam micro-CT scan using the contrast agent AuroVist 15 nm injected intravenously before image acquisition. Images were imported to MicroView software for analysis and segmentation. This representative image shows neovascularization of the bone fragment. Arrow points towards a mouse blood vessel leading to HBMI. (B) Bone fragments from HBMI mice transplanted (right) or not transplanted (left) with Molm13 cells were subjected to IHC staining for CD45 and osterix or CD45 and RUNX2 4 weeks after transplantation. The Opal multiplex system was used for signal amplification. CD45 was labeled with fluorescein (green), and RUNX2 and osterix were developed with Cy5 label (red). The nuclei were stained with DAPI (blue). Arrow points towards cells expressing osterix or RUNX2. Scale bar: 100 μm. (C) Quantification of osterix+ or RUNX2+ stromal cells from B. The absolute numbers of osterix+CD45– or RUNX2+CD45– stromal cells from HBMI mice transplanted or not transplanted with Molm13 cells were quantitated by inForm image analysis software. Immunohistochemical analysis was performed for osterix (D) and RUNX2 (E) in normal (left) or AML patient–derived (right) BM specimens. The Opal multiplex system was used for signal amplification. CD45 staining was developed with fluorescein (green), osterix staining was developed with Cy3 (yellow), and RUNX2 staining was developed with Cy5 (red). Scale bar: 100 μm. Unpaired Student’s t test was used to test the statistical difference between the 2 groups (*P < 0.05). Arrow points towards cells expressing osterix or RUNX2.

