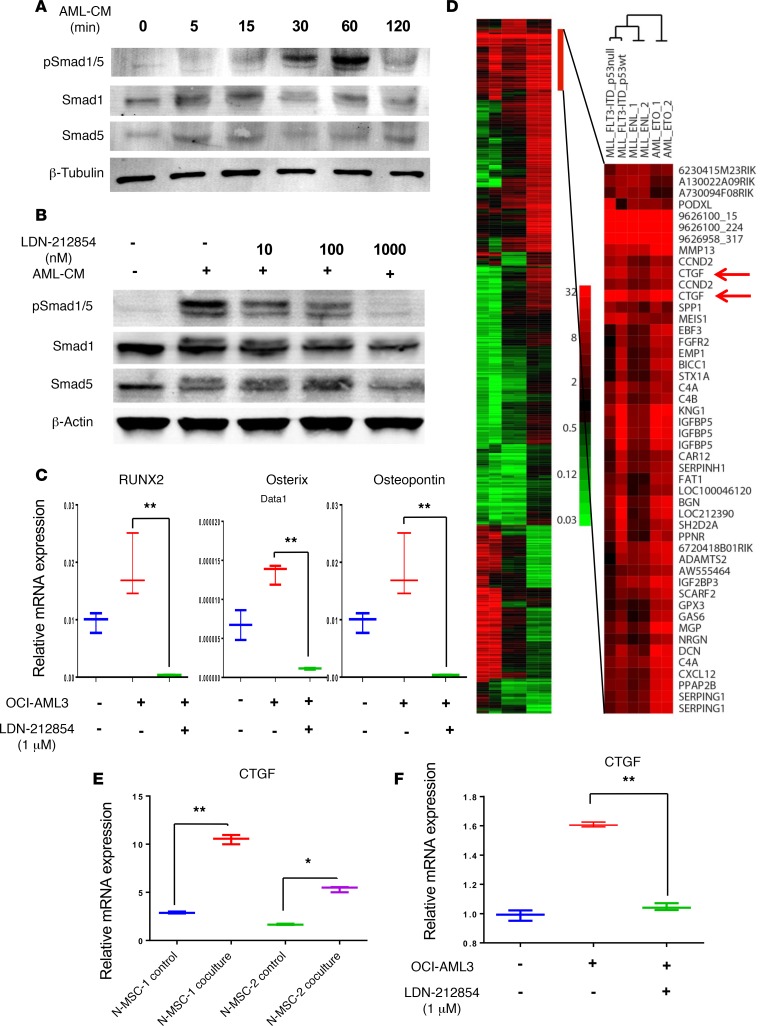
Figure 5. BMP signaling mediates AML-induced osteogenic differentiation and induces CTGF expression in MSCs.
(A) Immunoblotting was used to detect total and phosphorylated Smad1/5 in MSCs cultured with or without OCI-AML3–conditioned medium at indicated time points. (B) Immunoblotting also was used to detect total and pSmad1/5 in MSCs cultured with or without AML-CM in the presence or absence of type-1 BMP inhibitor LDN-212854 at indicated concentrations. β-Tubulin and β-actin served as loading controls. Data shown are representative of 3 independent experiments. (C) N-MSCs (2 × 10⁵) were cultured in OCI-AML3–conditioned medium (OCI-AML3) with or without LDN-212854 for 5 days. mRNA expression of osteoprogenitor-associated genes, RUNX2, osterix, and osteopontin, in the N-MSCs was measured by qRT-PCR. GAPDH served as an equal loading control. (D) Subtracted heatmap of change in microarray-based gene expression by BM-MSCs from in vivo exposure to different AML genotypes. Genes selected were those in which at least two of the genotype samples differed from control MSCs by at least 8-fold. The color bar shows the fold increase from normal MSC. Genes upregulated by all AML genotypes are expanded to the right. (E) N-MSCs were cocultured with or without OCI-AML3 cells for 5 days. After incubation, the N-MSCs were isolated by FACS, and total RNA was extracted from these cells. CTGF mRNA expression was analyzed by qRT-PCR (n = 2). (F) N-MSCs were cultured in the presence or absence of OCI-AML3–conditioned medium with or without LDN-212854 for 5 days. CTGF mRNA expression was measured by qRT-PCR. One-way ANOVA was used for comparisons of 3 or more groups and unpaired Student’s t test was used for comparisons of 2 groups (*P < 0.05, **P < 0.01 versus control). Tukey’s multiple comparison test was also performed for multiple data sets.

