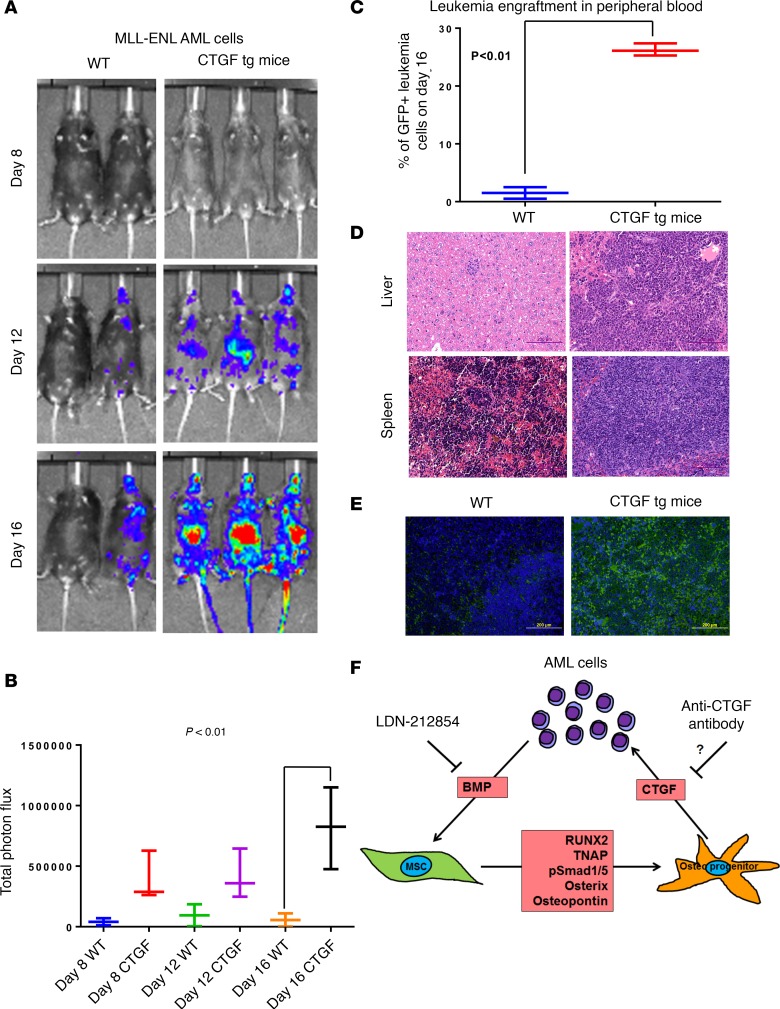
Figure 6. CTGF overexpression facilitates leukemia engraftment.
(A) MLL-ENL-GFP-Nras-FFluci-p53–/– syngeneic mouse AML cells (1 × 10⁵ per mouse) were transplanted intravenously into control (WT C57/B6; n = 3) or Colla2-CTGF–transgenic mice (CTGF tg; n = 3). Leukemic growth was measured by IVIS bioluminescence imaging at 8, 12, and 16 days after AML cell injection. (B) Total photon flux, representing the mean leukemia burden in the mice, was determined. (C) On day 16, peripheral blood mononuclear cells remaining after lysis of red blood cells were analyzed for GFP+ mouse leukemia cells by flow cytometry. (D) Sections of mouse spleen and liver from WT (left) or Col1a2-CTGF–transgenic mice were subjected to H&E staining on day 16 after AML cell transplantation. Scale bar: 200 μm. (E) GFP immunofluorescence staining of spleens from WT mice (left) and Colla2-CTGF–transgenic mice (right) by the anti-GFP antibody on day 16 after AML cell transplantation. Scale bar: 200 μm. (F) Schematic representation of leukemia-stroma interaction in the BM microenvironment. Two-way ANOVA was used to test the data set in B and unpaired Student’s t test was used for the data set in C (** P < 0.01, ***P < 0.001 versus control). In addition, Tukey’s multiple comparison test was also performed for the data set in B.

