Abstract
BACKGROUND. Induction of insulin resistance is a key pathway through which obesity increases risk of type 2 diabetes, hypertension, dyslipidemia, and cardiovascular events. Although the detrimental effects of obesity on insulin sensitivity are incompletely understood, accumulation of visceral, subcutaneous, and liver fat and impairment of insulin-induced muscle microvascular recruitment (MVR) may be involved. As these phenotypic changes often coincide in obesity, we aimed to unravel whether they independently contribute to insulin resistance and thus constitute separate targets for intervention.
METHODS. We measured visceral (VAT) and subcutaneous adipose tissue (SAT) volumes and intrahepatic lipid (IHL) content by MRI, and whole body glucose disposal (WBGD) and MVR (using contrast-enhanced ultrasound) responses to a euglycemic insulin clamp in lean (n = 25) and abdominally obese men (n = 52). Abdominally obese men were randomized to dietary weight loss intervention or habitual diet.
RESULTS. Obesity-associated increases in VAT, SAT, and IHL, along with the decrease in MVR, contributed independently to insulin resistance. Moreover, a dietary weight loss intervention reduced insulin resistance, and mediation analyses showed that decreased IHL and insulin-induced MVR, but not decreased VAT or SAT volumes, independently contributed to improved insulin resistance seen with weight loss.
CONCLUSION. Quantifying the mutually independent contributions of visceral and subcutaneous adipose tissue, intrahepatic lipid, and insulin-induced muscle microvascular recruitment reveals distinct targets for treating obesity-associated insulin resistance.
TRIAL REGISTRATION. Clinicaltrials.gov NCT01675401.
FUNDING. Funding was from the Top Institute Food and Nutrition.
Keywords: Endocrinology, Metabolism
Visceral and subcutaneous adipose tissue, intrahepatic lipid, and insulin-induced muscle microvascular recruitment provide distinct targets for obesity-associated insulin resistance.
Introduction
Insulin resistance, i.e. reduced insulin-induced whole body glucose disposal (WBGD), is common in obesity and plays a key role in obesity-associated type 2 diabetes, hypertension, dyslipidemia, and cardiovascular disease (1, 2). Several tissue-specific pathways, including adipose tissue, liver, and muscle, have been proposed to link obesity to insulin resistance; however, whether these pathways act independently of each other has not been elucidated.
Excess visceral adipose tissue (VAT) in obesity causes insulin resistance through increased lipolysis, dysregulation of adipokine release, and induction of low-grade inflammation (2–4). However, additional mechanisms that explain insulin resistance in obesity have been postulated, notably increased subcutaneous adipose tissue (SAT) (2), increased intrahepatic lipid (IHL) accumulation (5), and impairment of insulin-induced microvascular recruitment (MVR) in muscle (6).
SAT’s effect on insulin resistance is controversial; the increased lipolysis and adipokine dysregulation in SAT is considered to contribute to insulin resistance (2), yet a fat distribution pattern with high SAT and low VAT volumes is considered a metabolically healthy phenotype (7). The involvement of IHL, on the other hand, is also debated, as IHL has been postulated to be both a cause and a consequence of insulin resistance. Lipotoxicity of IHL rich in saturated fatty acids, diacylglycerols, and ceramides; secretion of inflammatory cytokines; and increased triglyceride synthesis by the fatty liver are suggestive of the former (8–10), whereas adipocyte insulin resistance with increased NEFA fluxes toward the liver suggests the latter (11, 12). In turn, skeletal muscle’s vasculature can contribute to insulin resistance when physiological insulin-induced, nitric oxide–mediated MVR is impaired (13).
A key question is whether VAT, SAT, IHL, and MVR act independently to increase insulin resistance. Mutual independence, in contrast to mutual dependence, implies that distinct mechanisms can be targeted to improve insulin resistance.
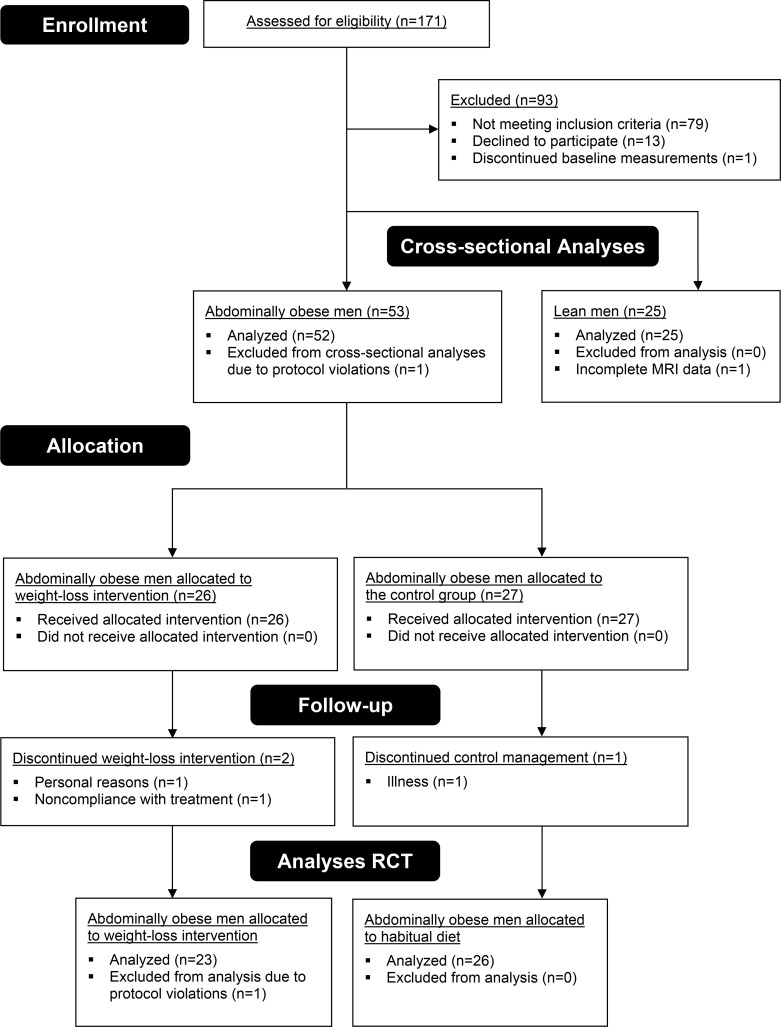
We addressed this issue in two ways. First, we determined the independent contributions of VAT, SAT, IHL, and MVR to insulin resistance in 25 lean and 52 abdominally obese men (flow diagram in Figure 1). Next, we assessed their contributions to weight loss–induced improvement of insulin resistance by randomizing the abdominally obese men to either an 8-week dietary weight loss program or habitual diet (control group).
Figure 1. Flow diagram of participants throughout the study.
After screening, 25 lean men were eligible for participation, and all completed the study. Baseline measurements were performed in 54 abdominally obese men; one dropped out for personal reasons before completing the measurements. For the cross-sectional analyses, all lean men and 52 abdominally obese men were included; one was excluded from analyses due to protocol violations (use of anti-hypertensive medication during participation). One lean individual did not complete the MR imaging due to claustrophobia. A total of 53 abdominally obese men were randomized to weight-loss intervention or weight-stable control groups. One individual discontinued control treatment because of illness; one dropped out because of noncompliance with the program to lose weight; and another individual dropped out for personal reasons after assignment to the weight-loss treatment. One individual completed the trial but was excluded from all analyses because of protocol violations. In agreement with the protocol, the study was stopped after 50 follow-up measurements were completed. Few harms were observed during this study; one individual had an incidental finding on MRI that required further analysis, and another individual developed thrombophlebitis after the follow-up measurements.
Results
Demographic and metabolic features of the study population.
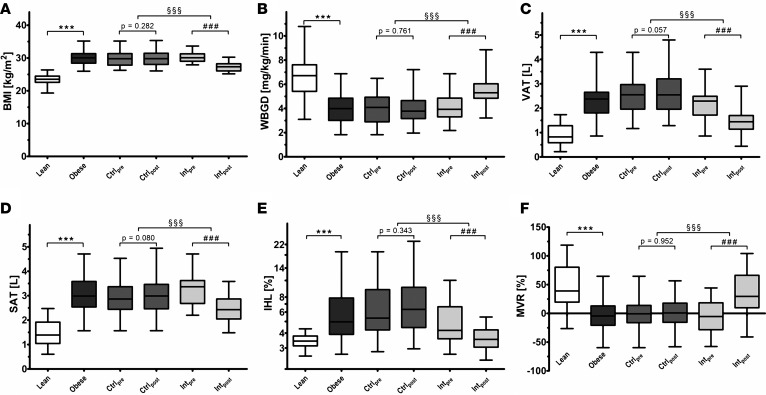
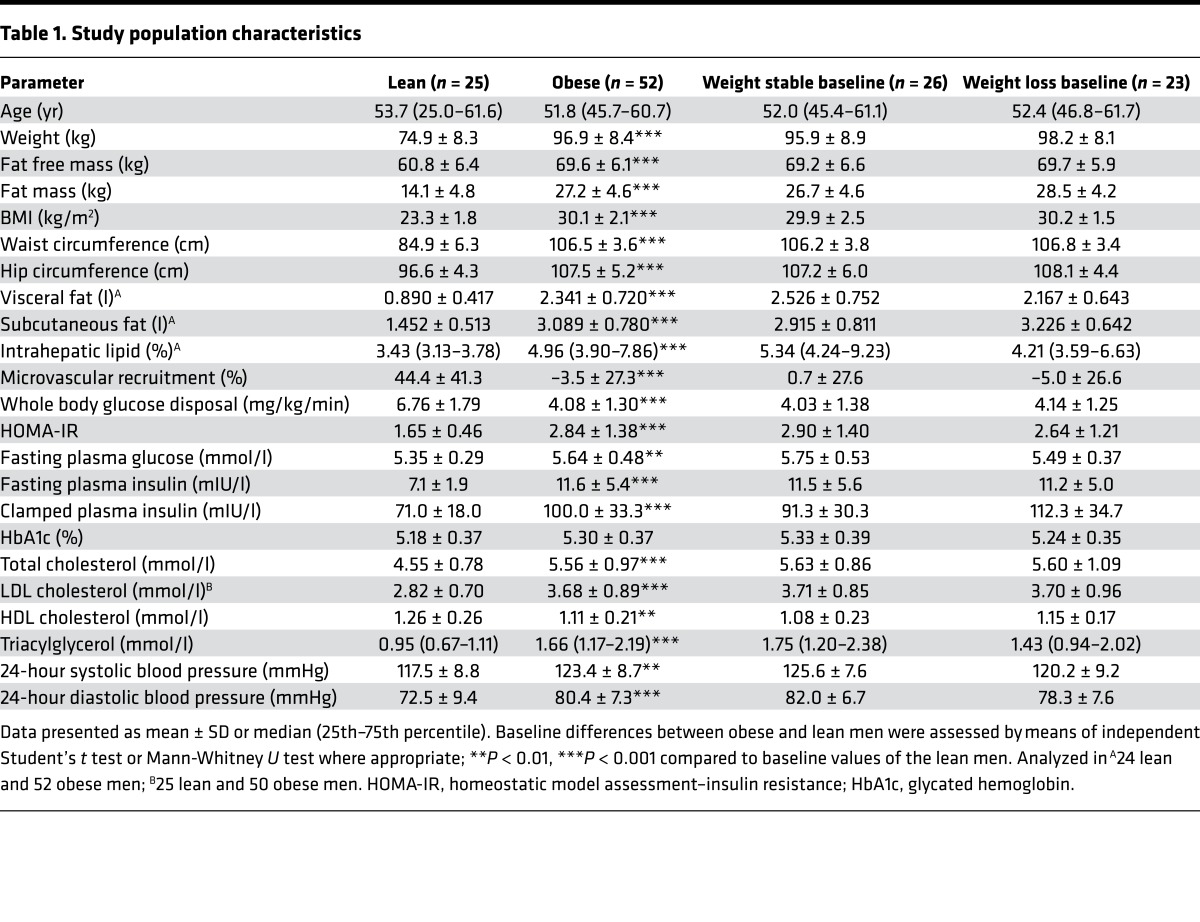
After a screening procedure, 25 lean and 52 abdominally obese individuals were enrolled in this study (Figure 1). Compared with lean men, abdominally obese men had higher BMI, VAT, SAT, and IHL, and lower MVR and WBGD during an insulin clamp (Figure 2; P < 0.001 for each). In addition, abdominally obese men had higher baseline homeostatic model assessment–insulin resistance (HOMA-IR), fasting plasma glucose, and fasting insulin levels compared with lean men (Table 1; P < 0.001 for each). At baseline, abdominally obese individuals randomized to the weight loss program and those randomized to the habitual diet were comparable (Table 1).
Figure 2. Features of the study population and effects of weight loss.
Levels of (A) BMI, (B) whole body glucose disposal (WBGD), (C) abdominal visceral adipose tissue volume (VAT), (D) abdominal subcutaneous adipose tissue volume (SAT), (E) intrahepatic lipid (IHL), and (F) insulin-induced muscle microvascular recruitment (MVR). Results for lean men (n = 25), abdominally obese men (n = 52), the control group at baseline (Ctrlpre; n = 26) and after follow-up (Ctrlpost; n = 26), and the intervention group at baseline (Intpre; n = 23) and after follow-up (Intpost; n = 23) are shown. One lean individual did not complete the MR imaging due to claustrophobia; analyses on VAT, SAT, and IHL are thus reported for 24 lean men. Box plots are as follows: black line, median; box edges, 1st and 3rd quartiles; whiskers, minimum and maximum of all data. Cross-sectional differences were assessed by means of independent Student’s t tests (lean vs. obese; ***P < 0.001), differences over time by means of paired t test (baseline vs. follow-up; ###P < 0.001), and differences between groups over time by means of 1-factor ANCOVA with baseline value as covariate (control group vs. intervention group; §§§P < 0.001).
Table 1. Study population characteristics.
Contributors to obesity-associated insulin resistance.
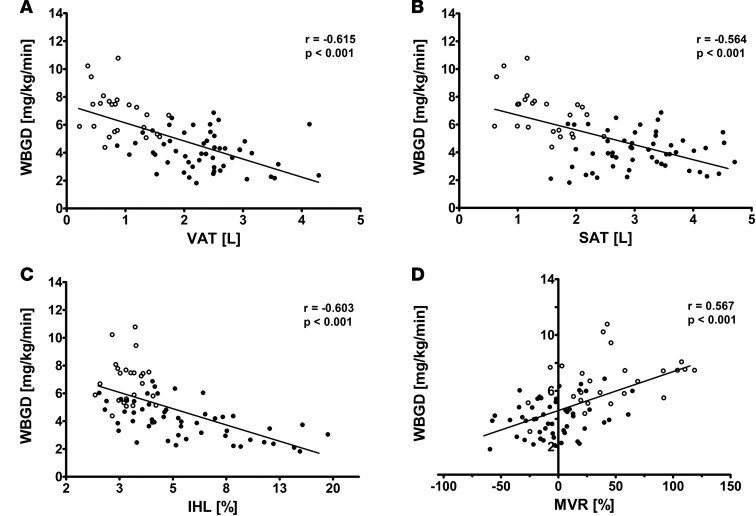
We observed that VAT (r = –0.615; P < 0.001), SAT (r = –0.564; P < 0.001), IHL (r = –0.603; P < 0.001), and MVR (r = 0.567; P <0.001) were each associated with WBGD (Figure 3). As expected, VAT, SAT, IHL, and MVR were all associated with one another, which can be inferred from the attenuation in the individual regression coefficients when the age-adjusted associations were additionally adjusted for the other variables (Table 2). Yet a multivariate regression model including VAT, SAT, IHL, and MVR as determinants of WBGD shows that each was independently associated with WBGD (Table 2). Of note, no statistically significant interaction between VAT and SAT was found (P = 0.223).
Figure 3. Cross-sectional bivariate associations between abdominal visceral adipose tissue, subcutaneous adipose tissue, intrahepatic lipid, and insulin-induced muscle microvascular recruitment, and whole body glucose disposal.
(A) Association between visceral adipose tissue (VAT) and whole body glucose disposal (WBGD) in lean (n = 24) and abdominally obese men (n = 52). (B) Association between subcutaneous adipose tissue (SAT) and WBGD in lean (n = 24) and abdominally obese men (n = 52). (C) Association between intrahepatic lipid (IHL) and WBGD in lean (n = 24) and abdominally obese men (n = 52). (D) Association between muscle microvascular recruitment (MVR) and WBGD in lean (n = 25) and abdominally obese men (n = 52). Data for lean (open circles) and abdominally obese men (filled circles) are shown. Pearson’s correlation coefficients and their P values are reported for all bivariate associations.
Table 2. Cross-sectional multivariate regression models with WBGD as dependent variable.
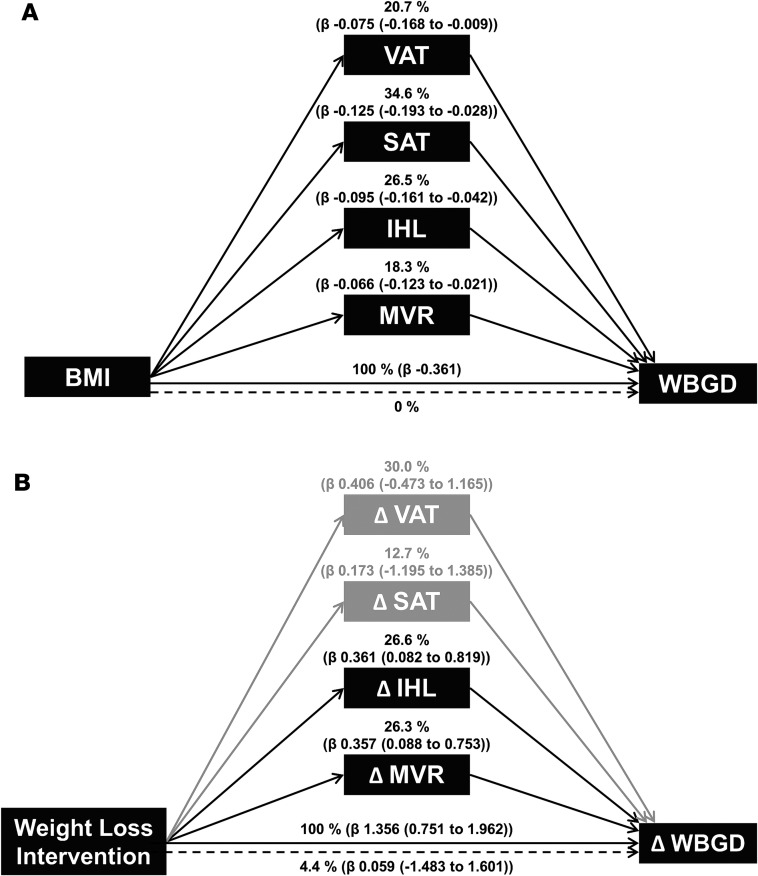
In addition, VAT (20.7%; 2.4% to 46.6%), SAT (34.6%; 7.6% to 53.5%), IHL (26.5%; 11.8% to 44.7%), and MVR (18.3%; 5.8% to 34.0%) were independent mediators of the association between BMI and WBGD (Figure 4A). Since the confidence intervals of the four mediators overlap, we cannot conclude that any one mediator is more important than any other.
Figure 4. Multiple mediator models.
(A) Multiple mediator model with visceral adipose tissue (VAT), subcutaneous adipose tissue (SAT), log-transformed intrahepatic lipid (IHL), and muscle microvascular recruitment (MVR) as statistically significant mediators [percentage of total effect mediated (β of mediated effect (95% CI using the Monte Carlo method))] of the association between BMI and whole body glucose disposal (WBGD; n = 76, age-adjusted). The CIs of the mediators overlap, which implies that no mediator contributes more than the other. (B) Multiple mediator model with ΔIHL and ΔMVR as statistically significant mediators [percentage of total effect mediated (β of mediated effect (bootstrapped 95% CI))] of the association between the weight loss intervention and ΔWBGD (n = 49, age-adjusted). The variables ΔVAT and ΔSAT were not statistically significant mediators of this association. The confidence intervals of the mediators overlap, which implies that no mediator contributes more than the other.
Effects of weight loss.
In abdominally obese men randomized to the control group, BMI, VAT, SAT, IHL, MVR, and WBGD were unchanged over time (Figure 2). Conversely, in abdominally obese men randomized to the weight loss intervention, BMI (–3.04 ± 0.77 kg/m2), VAT (–0.723 ± 0.371 l), SAT (–0.782 ± 0.261 l), and IHL (–1.69% ± 2.05%) decreased, whereas MVR (39.5% ± 49.0%) and WBGD (1.31 ± 1.22 mg/kg/min) increased (Figure 2; P < 0.001 for each vs. baseline; P < 0.001 for each vs. control group). After weight loss, IHL and MVR were similar to the mean values in lean men, while VAT and SAT remained increased and WBGD remained impaired. In addition, HOMA-IR (0.06 ± 0.84), fasting plasma glucose (0.00 ± 0.28 mmol/l), and fasting insulin levels (0.2 ± 3.0 mIU/l) did not change in the control group, whereas clamped insulin levels increased (15.2 ± 28.7 mIU/l; P = 0.012). In abdominally obese men randomized to the weight loss intervention, on the other hand, HOMA-IR (–0.97 ± 0.92; P < 0.001), fasting plasma glucose (–0.21 ± 0.33 mmol/l; P < 0.05), fasting insulin levels (–3.8 ± 3.5 mIU/l; P < 0.001), and clamped insulin levels (–26.1 ± 35.6 mIU/l; P = 0.002) decreased (P < 0.05 for each vs. control group).
Association with improved insulin resistance.
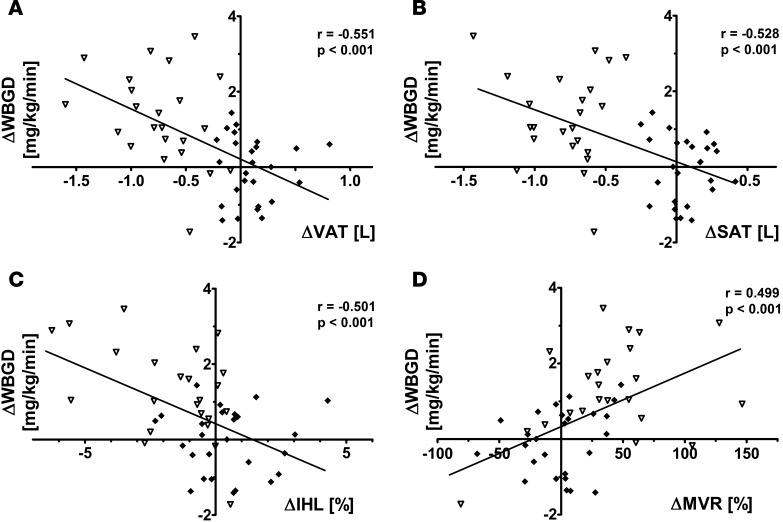
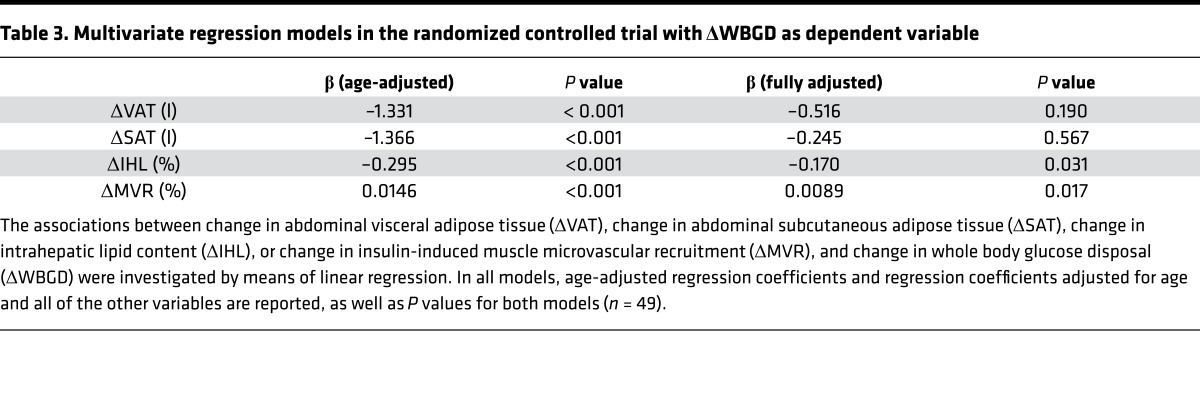
Changes in VAT (r = –0.551; P < 0.001), SAT (r = –0.528; P < 0.001), IHL (r = –0.501; P < 0.001), and MVR (r = 0.499; P < 0.001) were associated with changes in WBGD (Figure 5). Changes in VAT, SAT, IHL, and MVR were associated with one another, which was reflected by the attenuation in the individual regression coefficients when the age-adjusted associations were additionally adjusted for the other variables (Table 3). In a multivariate regression model, changes in IHL and changes in MVR, but not changes in VAT or SAT, were independently associated with changes in WBGD (Table 3). Consequently, the association between weight loss intervention and change in WBGD was independently mediated by changes in IHL (26.6%; 4.4% to 69.6%) and changes in MVR (26.3%; 2.4% to 59.9%), but not statistically significantly by changes in VAT or SAT (Figure 4B).
Figure 5. Bivariate associations between change in abdominal visceral adipose tissue volume, change in abdominal subcutaneous adipose tissue volume, change in intrahepatic lipid content, and change in insulin-induced muscle microvascular recruitment, and change in whole body glucose disposal (n = 49).
(A) Association between change in abdominal visceral adipose tissue volume (ΔVAT) and change in whole body glucose disposal (ΔWBGD). (B) Association between change in abdominal subcutaneous adipose tissue volume (ΔSAT) and ΔWBGD. (C) Association between change in intrahepatic lipid content (ΔIHL) and ΔWBGD. (D) Association between change in insulin-induced muscle microvascular recruitment (ΔMVR) and ΔWBGD. Data for abdominally obese controls (filled diamonds, n = 26) and abdominally obese men undergoing the weight loss intervention (open triangles, n = 23) are shown. Pearson’s correlation coefficients and their P values are reported for all bivariate associations.
Table 3. Multivariate regression models in the randomized controlled trial with ΔWBGD as dependent variable.
Sensitivity analyses.
We conducted sensitivity analyses by including the individual left out for protocol violations in the analyses, as well as using waist circumference or total fat mass in our model instead of BMI to reflect obesity, which did not materially change the results (data not shown). Moreover, we used WBGD with glucose space correction and WBGD with adjustment for insulin levels during the clamp as outcome in our models, which did not materially change the results (data not shown). Additionally, we performed multiple mediation analyses in the intervention group only, using a repeated measures design. These analyses confirmed that changes in IHL and changes in MVR were statistically significant mediators, whereas changes in VAT or SAT were not (data not shown).
Discussion
In this report we identified VAT, SAT, IHL, and MVR as mutually independent contributors to obesity-associated insulin resistance, therefore constituting separate targets for intervention. To our knowledge, no studies have simultaneously determined multiple tissue contributors to insulin resistance using state-of-the-art techniques in humans or assessed their mutual independence, either in the basal steady state or after a minimal weight loss intervention. Studies on the contributions of VAT, SAT, and IHL to insulin resistance in the basal state have been ambiguous. Some argue in favor of mutually independent contributions of VAT and IHL (11, 14), whereas others find that IHL, not VAT, associates with insulin resistance (5, 15). Similarly, the SAT contribution to insulin resistance, independent of VAT, is both supported (2) and disputed (16, 17). In addition, the contribution of MVR to insulin resistance has not been studied in parallel with VAT, SAT, or IHL. By measuring VAT, SAT, IHL, and MVR simultaneously, our data clarify that, at least in abdominally obese men, these variables contribute to insulin resistance independently and to a similar extent.
By decreasing obesity and insulin resistance with a weight loss intervention, we show that changes in IHL and MVR contribute to improved insulin sensitivity, which supports their tight connection with insulin resistance. Our data are insufficiently precise to exclude that changes in VAT and SAT contribute to improved insulin resistance with weight loss. At least for changes in VAT, involvement seems probable as it is estimated to mediate, albeit not statistically significantly, ~30% of the change in WBGD, an effect size consistent with its contribution to WBGD in the basal state. As we observed significant bivariate but not multivariate associations between changes in VAT and SAT on the one hand and WBGD on the other, the degree of VAT and SAT reduction achieved here may have been insufficient to improve insulin resistance in an independent way. This observation is in line with studies using interventions such as omentectomy (0.3 to 1.0 kg VAT loss; refs. 18, 19) or liposuction (0.4 to 1.7 kg SAT loss; ref. 20), which have limited effects on insulin resistance.
In addition to establishing relationships between VAT, SAT, IHL, and MVR on one hand and WBGD on the other, we aimed to provide a deeper understanding of the processes that contribute to obesity-associated insulin resistance. Multiple mediation analyses, as compared with multivariate regression, can provide a superior reflection of the causal chain one tries to investigate. This helps unravel contributions to disease etiology and to develop targeted, effective therapies (21). Specifically, the advantage of testing the mediating effect of multiple variables simultaneously is that one learns whether mediation is independent of the effect of the other mediators, which offers the possibility to compare competing theories against one another within a single model (22, 23). In addition, particularly when potential mediators have little random error (i.e., the measurement is precise and reflects the underlying mechanism well), multiple mediation analyses can be used to estimate the proportion of the total effect that independent mediators account for. A mediated proportion is essentially the product of two effects; in our analyses, the effect of obesity on each mediator is the first, and the independent effect of each mediator on insulin resistance is the second. Such multiple mediator models are therefore the integrated product of two multivariate regression models, which has clear advantages over the conventional approach of analyzing each effect with separate regression analyses. By using these multiple mediation analyses in this report, we were able to provide an estimate of the magnitude of the independent contributions of VAT, SAT, IHL, and MVR to obesity-associated insulin resistance.
Of note, the fact that we found complete statistically significant mediation (i.e., a sufficient set of potential component causes; ref. 24) in the cross-sectional model does not rule out the possible contribution of other variables not included in our statistical model. For example, determinants and consequences of the mediators identified could contribute if included in the analyses. We therefore do not claim to have identified all tissue contributors to obesity-associated insulin resistance.
Our study has some limitations. First, no additional measurements were conducted between baseline and follow-up, so we could not determine a temporal hierarchy of improvements for various contributors to insulin resistance. We emphasize that the aim of this study was not to provide an accurate time course for the exerted effects. Rather we used a weight loss intervention, an instrument to modify insulin resistance, to probe the contributions of changes in VAT, SAT, IHL, and MVR to improvement of insulin resistance. Also, this study was carried out in men only. Nevertheless, studies have shown similar (bivariate) associations between VAT, SAT, IHL, and MVR and insulin resistance in women, as well as improvements in these variables with weight loss (2, 25–28). Amounts of IHL and VAT are, however, typically greater in men, whereas the amount of SAT is greater in women (2, 10); this might affect the relative contribution of each mediator in women in the multiple mediator models. While we identified the relative contribution of each mediator in men in this study, their proportional contributions in women remain to be explored.
Here we have established for the first time to our knowledge the mutually independent contributions of VAT, SAT, IHL, and MVR to insulin resistance. This finding implies that, compared with interventions with a single target tissue, interventions aimed at multiple contributors to insulin resistance will yield superior effectiveness. Hence, therapies aimed at multiple therapeutic targets for insulin resistance will be most effective in reducing the global burden of type 2 diabetes and cardiovascular diseases.
Methods
Study population.
In this randomized controlled trial with blinded analyses, 53 abdominally obese and 25 lean men were recruited by advertisements and enrolled at the Maastricht University Medical Center in Maastricht, The Netherlands, from August 2012 to May 2014. Participants were aged 18–65 years, non-smokers, nondiabetic, free of CVD, had a waist circumference below 94 cm (lean) or between 102–110 cm (abdominally obese), and had a stable body weight for at least 3 months. Men were excluded when fasting plasma glucose was >7.0 mmol/l, when glycated hemoglobin (HbA1c) was >6.5%, when serum total cholesterol was >8.0 mmol/l, when serum triacylglycerol was >4.5 mmol/l, when they had a contra-indication for MR imaging, and/or when they used medication affecting blood pressure, serum lipid, or glucose metabolism.
Study design.
Abdominally obese men were randomly assigned at a 1:1 ratio to either an 8-week weight loss program or maintaining their habitual diet for 8 weeks. Abdominally obese men were studied at baseline and after completion of their 8-week program. Lean men were studied at baseline only and thus not randomized. Randomization was performed by an independent investigator using block randomization with variable block sizes and stratifying for ages below and above 50 years. The allocation was revealed by the independent investigator to the participant and research team upon completion of all baseline measurements. Study data were blinded to the assessor prior to analysis and de-blinded upon completion of all analyses by an independent investigator.
The weight loss program consisted of 4–5 weeks of a very low-calorie diet providing 2.1 MJ/d (Modifast, Novartis Nutrition), 1–2 weeks of energy-restricted diet providing 4.2 MJ/d, a weight-stable phase of 2 weeks to maintain the newly achieved weight, and weekly dietary counseling. During the 8-week habitual diet, the control group was monitored as well in order to avert fluctuations in weight. Both groups were instructed not to alter their exercise pattern throughout the study. Three individuals dropped out, and one individual was excluded from analyses due to protocol violations (Figure 1). A sample size of 25 individuals per group was calculated to detect a mean difference in MVR, the least precise of the techniques used, of 20% with a power (1 – β) of 0.80 with α = 0.95. In agreement with our protocol, the study was stopped after 50 follow-up measurements were completed.
Measurements were conducted in a temperature-controlled room (T = 24 ± 0.5°C) after a 12-hour overnight fast with the individuals in the supine position. Individuals were instructed to refrain from alcohol and meals rich in lipids for a period of 24 hours prior to each study day, and strenuous physical exercise for a period of 48 hours prior to each study day. After insertion of two intravenous catheters and a 30-minute acclimatization period, baseline vascular measurements were performed.
Hyperinsulinemic euglycemic clamp.
Metabolic insulin sensitivity was assessed by a 1 mU/kg/min euglycemic insulin clamp as described previously (29). Briefly, insulin (NovoRapid, Novo Nordisk) was infused in a primed continuous manner for 180 minutes. Meanwhile, isoglycemia was maintained with a variable rate 20% glucose infusion. Metabolic insulin sensitivity was estimated from the steady-state glucose infusion rate (90–150 minutes of the clamp).
Contrast enhanced ultrasound.
Microvascular blood volume of forearm skeletal muscle was measured with a Toshiba Aplio XG ultrasound system (Toshiba) during continuous infusion of sulfur hexafluoride gas-filled microbubbles (SonoVue, Bracco Diagnostics). After steady-state microbubble concentration was achieved (3 minutes), 5 real-time replenishment curves of 30 seconds were obtained after microbubble disruption by a high mechanical index ultrasound pulse. These replenishment curves were stored and analyzed offline in a blinded fashion upon completion of the trial using CHI-Q software (Toshiba). The replenishment curves were fitted to the exponential function y = A(1 – e–βt) and averaged as described previously (26), providing reliable estimations of MVR (ICCintra-observer [intra-observer intraclass correlation coefficient] = 0.86; P < 0.001). MVR was calculated as the relative increase in microvascular blood volume induced by the insulin clamp.
Visceral and subcutaneous fat volumes, and IHL.
Information on VAT and SAT volumes was obtained through two-dimensional (2D) T1-weighted turbo spin echo (TSE) imaging on a 3.0T Philips Achieva MRI scanner with a dedicated sixteen-element torso coil (XL Torso Coil, Philips Healthcare). Nine 5-mm-thick transverse slices with 10-mm gaps centered at the top of the L4 vertebral body were acquired using the following scan parameters: repetition time (TR) = 526 ms, echo time (TE) = 10 ms, turbo spin echo factor = 4, number of signal averages (NSA) = 1, field of view (FOV) = 400 × 322 mm, acquired matrix size = 308 × 164, acquired in-plane voxel size = 1.3 × 1.96 mm, reconstructed matrix size = 512 × 412 mm, and a reconstructed voxel size of 0.78 × 0.78 mm. Images were analyzed offline after completion of the trial with dedicated software (Hippo Fat, Institute of Clinical Physiology, CNR, Pisa, Italy) to provide subcutaneous and visceral fat volumes.
The same MRI scanner and coil were used to assess IHL content through mDixon imaging. Two 6-mm-thick transverse slices through the liver were acquired using a 2D three-point T1-fast field echo (T1-FFE) mDixon pulse sequence, to correct for T2* relaxation. The scan parameters were as follows: TR = 150 ms, TE1 = 0.85 ms, ΔTE = 0.7 ms, flip angle (FA) = 10°, NSA = 1, FOV = 375 × 310 mm, acquired matrix size = 92 × 77, acquired in-plane resolution = 4.08 × 4.02 mm, reconstructed matrix size = 384 × 320 mm, and a reconstructed voxel size of 0.98 × 0.97 mm. The intrahepatic fat percentage was calculated in three regions of interest within the liver parenchyma, carefully avoiding blood vessels. The fat content was expressed as the weighted mean fat signal, divided by the sum of the weighted mean water and fat signal. The mDixon sequence was validated against proton magnetic resonance spectroscopy (1H-MRS) in a random subset of participants, which yielded comparable results (n = 45; ICCagreement = 0.82; P < 0.001). The 1H-MRS scan was performed using the same MRI scanner and torso coil, and the spectra were obtained from a 30 × 30 × 30 mm voxel placed centrally in the right lobe of the liver by using point-resolved spectroscopy volume selection (PRESS) with the following scan parameters: TR = 4,000 ms, TE = 32.5 ms, 2,048 sample points. A total of 32 spectra with NSA of 2 were acquired. A water signal was acquired as a reference (NSA = 2 × 8). To keep the TR constant, the subject was instructed to breathe exactly at the 4-second rhythm of the sequence. Shimming was performed by using second-order FASTMAP (fast, automatic shimming technique by mapping along projections)–based shimming.
Plasma measurements.
Plasma glucose was determined with a YSI2300 glucose analyzer (YSI). Samples were analyzed for total cholesterol (CHOD-PAP method; Roche Diagnostics), HDL cholesterol (precipitation method; Roche Diagnostics), triacylglycerol with correction for free glycerol (GPO Trinder; Sigma-Aldrich), HbA1c (Bio-Rad), and insulin (RIA; Millipore).
Statistics.
Data are expressed as mean ± SD or median (25th–75th percentile). Two-tailed independent Student’s t tests or Mann-Whitney U tests were used to assess differences between groups at baseline. We used 1-factor analysis of covariance (ANCOVA) with the baseline value as a covariate to detect differences between groups over time. Analyses were performed using SPSS version 20 (IBM Corp.). Multiple mediation analyses were carried out with the PROGRESS plug-in for SPSS version 2.13 (A.F. Hayes, Ohio State University, Columbus, Ohio, USA). In the cross-sectional mediation model, complete mediation was found. Therefore, the independent variable BMI was omitted from the model to estimate the contributions of each mediator (30), and Monte Carlo confidence intervals were calculated with R statistical software (version 3.2.2; https://www.r-project.org/). For sensitivity analyses, we also used multiple mediation analyses with a repeated measures design, which were carried out with the MEMORE plug-in for SPSS. All regression and mediation models were adjusted for the potential confounder age. Two-tailed P values less than 0.05 were considered statistically significant.
Study approval.
The study was approved by the Maastricht University Medical Center ethics committee, performed in accordance with the Declaration of Helsinki, and registered at clinicaltrials.gov (NCT01675401). All participants gave written informed consent.
Author contributions
YHAMK, CGS, AJHMH, PJJ, JP, RPM, and CDAS designed the study. MEK designed the MRI protocol, and LL provided the 1H-MRS validation. YHAMK and EJB designed the contrast-enhanced ultrasound protocol. YHAMK and JR performed the measurements included in this article, and YHAMK performed the analyses. YHAMK and CDAS wrote the manuscript. All authors critically read and commented on the manuscript.
Supplementary Material
Acknowledgments
We thank dieticians N.A.W.M. Wystyrk and D.J. Luiten for the dietary counseling of the individuals in this trial, P.M.G. Niessen (Department of Internal Medicine, Maastricht University Medical Center) for assistance during the execution of this study, and C.J.A.W. van Gool (Department of Epidemiology, Maastricht University) for epidemiological counseling. This work was supported by research grant CH001 from the Top Institute Food and Nutrition, a public-private partnership on pre-competitive research in food and nutrition. The public partners are responsible for the study design, data collection and analysis, decision to publish, and preparation of the manuscript.
Footnotes
Role of funding source: This work was supported by research grant CH001 from the Top Institute Food and Nutrition, a public-private partnership on pre-competitive research in food and nutrition. The public partners are responsible for the study design, data collection and analysis, decision to publish, and preparation of the manuscript.
Conflict of interest: M.E. Kooi reports grants from CTMM PARISk, outside the scope of the submitted work.
Reference information: JCI Insight. 2017;2(13):e89695. https://doi.org/10.1172/jci.insight.89695.
Contributor Information
Casper G. Schalkwijk, Email: c.schalkwijk@maastrichtuniversity.nl.
Alfons J.H.M. Houben, Email: b.houben@maastrichtuniversity.nl.
Lucas Lindeboom, Email: lucas.lindeboom@maastrichtuniversity.nl.
Jogchum Plat, Email: j.plat@maastrichtuniversity.nl.
Coen D.A. Stehouwer, Email: cda.stehouwer@mumc.nl.
References
- 1.DeFronzo RA, Ferrannini E. Insulin resistance. A multifaceted syndrome responsible for NIDDM, obesity, hypertension, dyslipidemia, and atherosclerotic cardiovascular disease. Diabetes Care. 1991;14(3):173–194. doi: 10.2337/diacare.14.3.173. [DOI] [PubMed] [Google Scholar]
- 2.Preis SR, et al. Abdominal subcutaneous and visceral adipose tissue and insulin resistance in the Framingham heart study. Obesity (Silver Spring) 2010;18(11):2191–2198. doi: 10.1038/oby.2010.59. [DOI] [PMC free article] [PubMed] [Google Scholar]
- 3.Mårin P, et al. The morphology and metabolism of intraabdominal adipose tissue in men. Metab Clin Exp. 1992;41(11):1242–1248. doi: 10.1016/0026-0495(92)90016-4. [DOI] [PubMed] [Google Scholar]
- 4.Kershaw EE, Flier JS. Adipose tissue as an endocrine organ. J Clin Endocrinol Metab. 2004;89(6):2548–2556. doi: 10.1210/jc.2004-0395. [DOI] [PubMed] [Google Scholar]
- 5.Fabbrini E, et al. Intrahepatic fat, not visceral fat, is linked with metabolic complications of obesity. Proc Natl Acad Sci USA. 2009;106(36):15430–15435. doi: 10.1073/pnas.0904944106. [DOI] [PMC free article] [PubMed] [Google Scholar]
- 6.de Jongh RT, Serné EH, IJzerman RG, de Vries G, Stehouwer CD. Impaired microvascular function in obesity: implications for obesity-associated microangiopathy, hypertension, and insulin resistance. Circulation. 2004;109(21):2529–2535. doi: 10.1161/01.CIR.0000129772.26647.6F. [DOI] [PubMed] [Google Scholar]
- 7.Stefan N, Häring HU, Hu FB, Schulze MB. Metabolically healthy obesity: epidemiology, mechanisms, and clinical implications. Lancet Diabetes Endocrinol. 2013;1(2):152–162. doi: 10.1016/S2213-8587(13)70062-7. [DOI] [PubMed] [Google Scholar]
- 8.Samuel VT, Shulman GI. Mechanisms for insulin resistance: common threads and missing links. Cell. 2012;148(5):852–871. doi: 10.1016/j.cell.2012.02.017. [DOI] [PMC free article] [PubMed] [Google Scholar]
- 9.Byrne CD. Dorothy Hodgkin Lecture 2012: non-alcoholic fatty liver disease, insulin resistance and ectopic fat: a new problem in diabetes management. Diabet Med. 2012;29(9):1098–1107. doi: 10.1111/j.1464-5491.2012.03732.x. [DOI] [PubMed] [Google Scholar]
- 10.Yki-Järvinen H. Non-alcoholic fatty liver disease as a cause and a consequence of metabolic syndrome. Lancet Diabetes Endocrinol. 2014;2(11):901–910. doi: 10.1016/S2213-8587(14)70032-4. [DOI] [PubMed] [Google Scholar]
- 11.Gaggini M, Morelli M, Buzzigoli E, DeFronzo RA, Bugianesi E, Gastaldelli A. Non-alcoholic fatty liver disease (NAFLD) and its connection with insulin resistance, dyslipidemia, atherosclerosis and coronary heart disease. Nutrients. 2013;5(5):1544–1560. doi: 10.3390/nu5051544. [DOI] [PMC free article] [PubMed] [Google Scholar]
- 12.Bugianesi E, et al. Insulin resistance in non-diabetic patients with non-alcoholic fatty liver disease: sites and mechanisms. Diabetologia. 2005;48(4):634–642. doi: 10.1007/s00125-005-1682-x. [DOI] [PubMed] [Google Scholar]
- 13.Jonk AM, Houben AJ, de Jongh RT, Serne EH, Schaper NC, Stehouwer CD. Microvascular dysfunction in obesity: a potential mechanism in the pathogenesis of obesity-associated insulin resistance and hypertension. Physiology (Bethesda) 2007;22:252–260. doi: 10.1152/physiol.00012.2007. [DOI] [PubMed] [Google Scholar]
- 14.Liu J, Fox CS, Hickson D, Bidulescu A, Carr JJ, Taylor HA. Fatty liver, abdominal visceral fat, and cardiometabolic risk factors: the Jackson Heart Study. Arterioscler Thromb Vasc Biol. 2011;31(11):2715–2722. doi: 10.1161/ATVBAHA.111.234062. [DOI] [PMC free article] [PubMed] [Google Scholar]
- 15.Magkos F, Fabbrini E, Mohammed BS, Patterson BW, Klein S. Increased whole-body adiposity without a concomitant increase in liver fat is not associated with augmented metabolic dysfunction. Obesity (Silver Spring) 2010;18(8):1510–1515. doi: 10.1038/oby.2010.90. [DOI] [PMC free article] [PubMed] [Google Scholar]
- 16.Ross R, Aru J, Freeman J, Hudson R, Janssen I. Abdominal adiposity and insulin resistance in obese men. Am J Physiol Endocrinol Metab. 2002;282(3):E657–663. doi: 10.1152/ajpendo.00469.2001. [DOI] [PubMed] [Google Scholar]
- 17.Rendell M, Hulthén UL, Törnquist C, Groop L, Mattiasson I. Relationship between abdominal fat compartments and glucose and lipid metabolism in early postmenopausal women. J Clin Endocrinol Metab. 2001;86(2):744–749. doi: 10.1210/jcem.86.2.7260. [DOI] [PubMed] [Google Scholar]
- 18.Lima MM, et al. Visceral fat resection in humans: effect on insulin sensitivity, beta-cell function, adipokines, and inflammatory markers. Obesity (Silver Spring) 2013;21(3):E182–E189. doi: 10.1002/oby.20030. [DOI] [PubMed] [Google Scholar]
- 19.Fabbrini E, et al. Surgical removal of omental fat does not improve insulin sensitivity and cardiovascular risk factors in obese adults. Gastroenterology. 2010;139(2):448–455. doi: 10.1053/j.gastro.2010.04.056. [DOI] [PMC free article] [PubMed] [Google Scholar]
- 20.Klein S, et al. Absence of an effect of liposuction on insulin action and risk factors for coronary heart disease. N Engl J Med. 2004;350(25):2549–2557. doi: 10.1056/NEJMoa033179. [DOI] [PubMed] [Google Scholar]
- 21.Preacher KJ, Hayes AF. SPSS and SAS procedures for estimating indirect effects in simple mediation models. Behav Res Methods Instrum Comput. 2004;36(4):717–731. doi: 10.3758/BF03206553. [DOI] [PubMed] [Google Scholar]
- 22. Kenny DA, Kashy DA, Bolger N. Data analysis in social psychology. In: Gilbert D, Fiske S, Lindzey G, eds. The Handbook of Social Psychology. Vol 1. 4th ed. Boston, Massachusetttes, USA: McGraw-Hill; 1998:233–265. [Google Scholar]
- 23.Preacher KJ, Hayes AF. Asymptotic and resampling strategies for assessing and comparing indirect effects in multiple mediator models. Behav Res Methods. 2008;40(3):879–891. doi: 10.3758/BRM.40.3.879. [DOI] [PubMed] [Google Scholar]
- 24.Rothman KJ. Causes. Am J Epidemiol. 1976;104(6):587–592. doi: 10.1093/oxfordjournals.aje.a112335. [DOI] [PubMed] [Google Scholar]
- 25.Pourhassan M, Bosy-Westphal A, Schautz B, Braun W, Glüer CC, Müller MJ. Impact of body composition during weight change on resting energy expenditure and homeostasis model assessment index in overweight nonsmoking adults. Am J Clin Nutr. 2014;99(4):779–791. doi: 10.3945/ajcn.113.071829. [DOI] [PubMed] [Google Scholar]
- 26.Clerk LH, Vincent MA, Jahn LA, Liu Z, Lindner JR, Barrett EJ. Obesity blunts insulin-mediated microvascular recruitment in human forearm muscle. Diabetes. 2006;55(5):1436–1442. doi: 10.2337/db05-1373. [DOI] [PubMed] [Google Scholar]
- 27.Kotronen A, et al. A common variant in PNPLA3, which encodes adiponutrin, is associated with liver fat content in humans. Diabetologia. 2009;52(6):1056–1060. doi: 10.1007/s00125-009-1285-z. [DOI] [PubMed] [Google Scholar]
- 28.Petersen KF, Dufour S, Befroy D, Lehrke M, Hendler RE, Shulman GI. Reversal of nonalcoholic hepatic steatosis, hepatic insulin resistance, and hyperglycemia by moderate weight reduction in patients with type 2 diabetes. Diabetes. 2005;54(3):603–608. doi: 10.2337/diabetes.54.3.603. [DOI] [PMC free article] [PubMed] [Google Scholar]
- 29.DeFronzo RA, Tobin JD, Andres R. Glucose clamp technique: a method for quantifying insulin secretion and resistance. Am J Physiol. 1979;237(3):E214–E223. doi: 10.1152/ajpendo.1979.237.3.E214. [DOI] [PubMed] [Google Scholar]
- 30.Shrout PE, Bolger N. Mediation in experimental and nonexperimental studies: new procedures and recommendations. Psychol Methods. 2002;7(4):422–445. doi: 10.1037/1082-989X.7.4.422. [DOI] [PubMed] [Google Scholar]
Associated Data
This section collects any data citations, data availability statements, or supplementary materials included in this article.


