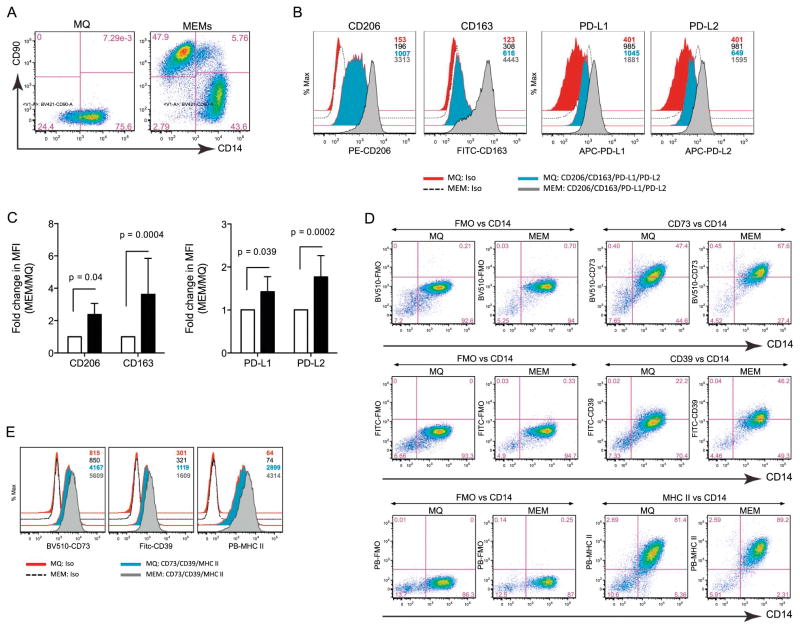
Figure 1. MEMs express higher levels of CD206, CD163, PD-L1, PD-L2, CD39 and CD73.
On day +10 of ex vivo expansion, MØ or MEMs were analyzed by flow cytometry for CD90 and CD14. (A) CD14+CD90− cells are MØs. CD14−CD90+ cells are MSCs. (B) Cell surface expression of CD206, CD163, PD-L1 and PD-L2 were determined on the CD14+CD90− population in MØ and MEM cultures by MFI (Mean fluorescent intensity) of isotypes (iso), MØs and MEMs, respectively. Numbers denote the MFIs for each group with color-matched histograms. (C) CD206, CD163, PD-L1/L2 fold change in MFI in MEM over MØ from 6 donors. (D) Expression of CD73, CD39, MHC II (HLA-DR) of fluorescent minus one (FMO) vs. CD14 on MØ and MEMs. (E) MFI of iso, MØs and MEMs for CD73, CD39 or MHC II. Numbers in plots denote MFI for each group. Bar graph statistics (mean ± SEM) by Two-way ANOVA with Bonferroni multiple comparisons.

