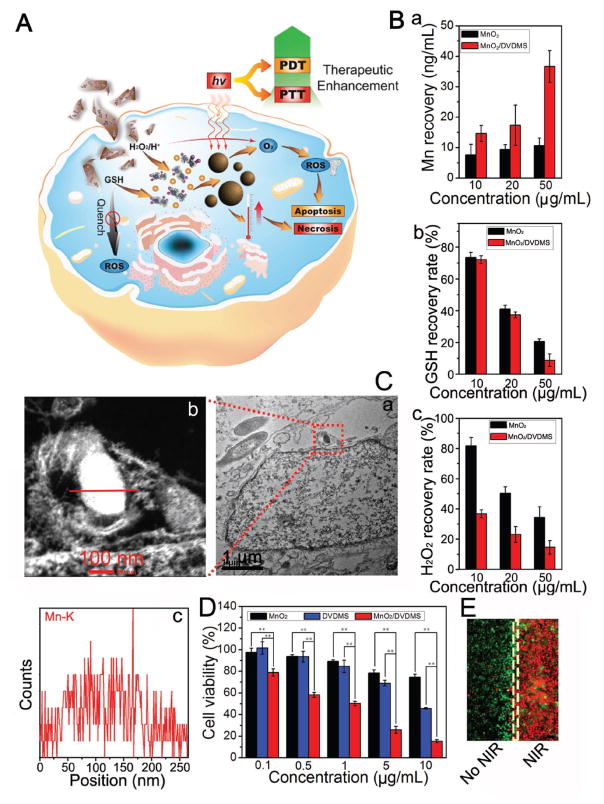
Figure 3.
A) Schematic illustration of the PDT/PTT procedure for MnO2/DVDMS. B) The amount of Mn (a), GSH (b), and H2O2 (c) recovery after the cells were cultured with MnO2 and MnO2/DVDMS (MnO2: 10, 20, and 50 μg mL−1). C) Thin-section cell TEM images of MnO2/DVDMS incubated in MCF-7 cells (a) and the element line scanning (Mn) of the reassembled nanostructure (b,c). D) Cell viability of the MCF-7 cells at different dosages of MnO2, DVDMS, and MnO2/DVDMS with laser irradiation (630 nm, 130 mW cm−2, 8 min) (**P < 0.01). E) Calcein-AM/PI staining of cells after exposure to MnO2/DVDMS with or without NIR laser irradiation, scale bar ≈200 μm.

