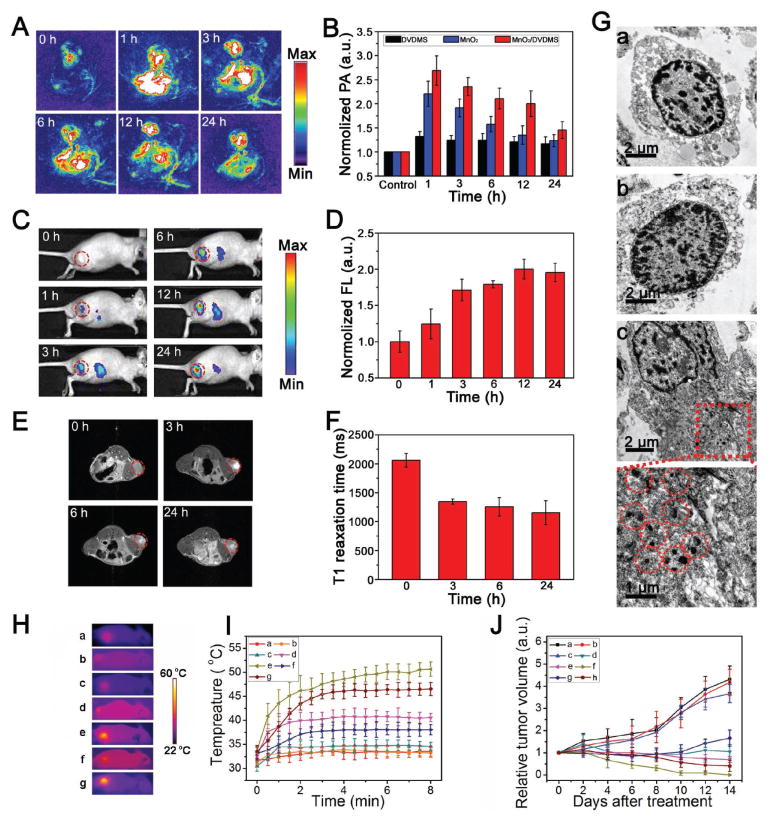
Figure 4.
A) PA images before and after an intratumoral injection of MnO2/DVDMS. B) Region of interest (ROI) analysis of the PA signal before and after injection of DVDMS, MnO2, and MnO2/DVDMS (1, 3, 6, 12, and 24 h). C) Fluorescence images and D) ROI intensity of the tumor after injection of MnO2/DVDMS. E) T1-weighted MR images and F) T1 relaxation time before and after injection of MnO2/DVDMS. G) TEM images of MCF-7 tumor thin sections at 24 h after injection of DVDMS (a), MnO2 (b), and MnO2/DVDMS (c). H) Thermal images and I) tumor temperature increase for different treatments: (a) saline control + laser; (b) MnO2 (i.t.) + laser; (c) DVDMS (i.t.) + laser; (d) DVDMS (i.t.) + Mn2+ (i.t.) + laser; (e) MnO2/DVDMS (i.t.) + laser; (f) DVDMS (i.v.) + laser; (g) MnO2/DVDMS (i.v.) + laser. J) MCF-7 tumor growth curves of mice treated with different methods: (a) saline control; (b) MnO2/DVDMS (i.t.); (c) saline control + laser; (d) DVDMS (i.t.) + laser; (e) DVDMS (i.t.) + Mn2+ (i.t.) + laser; (f) MnO2/DVDMS (i.t.) + laser; (g) DVDMS (i.v.) + laser; (h) MnO2/DVDMS (i.v.) + laser.

