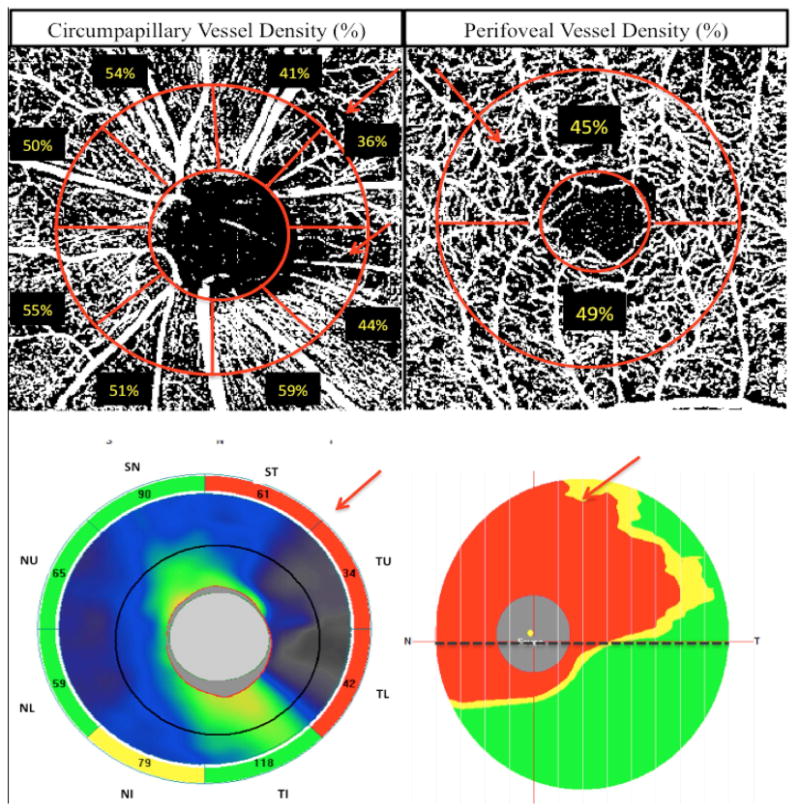
Figure 1.

Top row: Vessel density map of the peripapillary retinal nerve fiber layer with circumpapillary (cpVD) measurement region defined (left) and macular superficial layer with perifoveal (pfVD) measurement region defined (right). Bottom row: spectral domain optical coherence tomography (SD-OCT) optic nerve head (ONH) thickness map (left) and macular ganglion cell complex (mGCC) thickness map (right).
