
Figure 5.
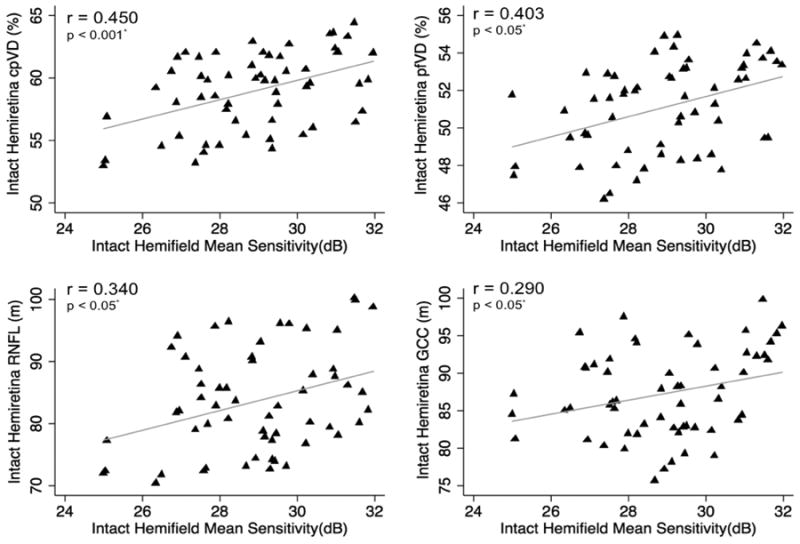
Scatterplots illustrating the linear (grey line) associations between standard automated perimetry (SAP) mean sensitivity in the perimetrically intact hemifields and optical coherence tomography angiography (OCT-A) circumpapillary vessel density (cpVD), perifoveal vessel density (pfVD), spectral domain (SD) OCT retinal nerve fiber layer (RNFL) and ganglion cell complex (GCC) thickness measurements in the corresponding hemiretinae of glaucoma eyes. r: correlation coefficient from the fitted linear regression model.