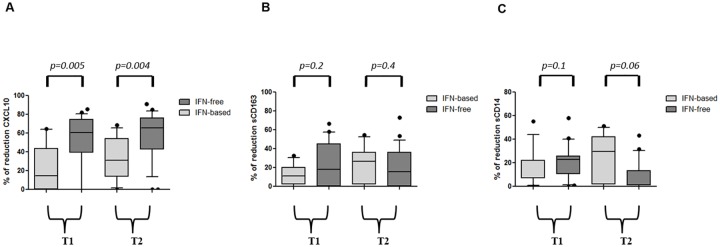
Fig 3. Different impact of anti-HCV regimens on soluble biomarkers.
Box plots represent the reduction rate of CXCL10 (panel A), sCD163 (panel B) and sCD14 (panel C) at T1 and T2 versus T0. Box plots show 10th, 50th (median), 90th, percentile and whiskers. Horizontal bars represent the median values. Statistical differences were assessed between IFN-based versus IFN-free treatment group at T1 and T2, by Mann-Whitney test. T0: baseline before therapy; T1: after 4 weeks of therapy; T2: 12 weeks after the end of treatment for R patient.

