Figure 1.
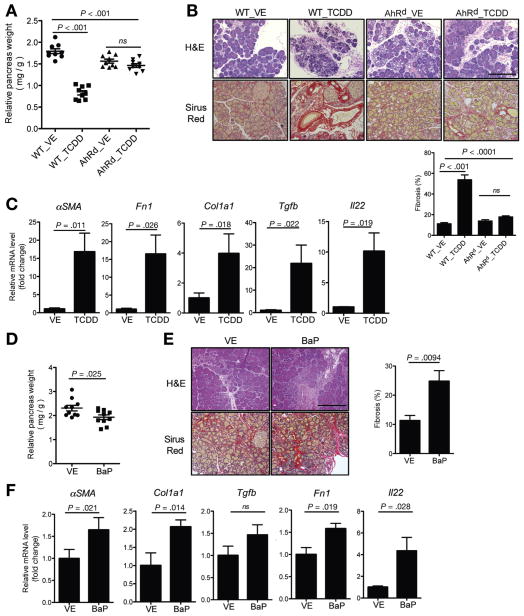
AhR activation worsens fibrosis in chronic pancreatitis. (A) Vehicle (VE) or AhR ligand (TCDD, 10 μg/kg, once per week) was administrated to C57BL/6J WT or AhRd mice right after starting CP induction with caerulein, and mice were euthanized and tissues harvested after 4 weeks of caerulein injection. Relative pancreas weights from indicated groups are shown (n = 9, pooled from 3 independent experiments, mean ± SEM, one-way analysis of variance [ANOVA], Tukey’s post-hoc test; ns, no significance). (B) Representative of pancreas H&E and Sirus Red staining. Scale bar = 200 μm. Quantitated fibrotic areas are shown in bar graph (mean ± SEM, one-way ANOVA, Tukey’s post-hoc test). (C) Quantitative reverse transcription polymerase chain reaction (RT-PCR) analysis of αSMA (α-SMA), Col1α1 (collagen1A1), Fn1 (fibronectin), Tgfb (TGFβ), and Il22 (IL22) gene expression in the pancreas from VE- or TCDD-treated WT mice (mean ± SEM, unpaired 2-tailed Student t test). (D) VE or BaP (25 mg/kg, daily) was orally administrated to Balb/c WT mice undergoing CP induction, and mice were euthanized and tissues harvested after 4 weeks of caerulein injection. Relative pancreas weights from indicated groups are shown (n = 10, pooled from 2 independent experiments, mean ± SEM, unpaired 2-tailed Student t test). (E) Representative of pancreas H&E and Sirus Red staining. Scale bar = 200 μm. Quantitated fibrotic areas are shown in bar graph (mean ± SEM). (F) Quantitative RT-PCR analysis of αSMA, Col1α1, Fn1, Tgfb, and Il22 expression in the pancreas from VE- or BaP-treated mice. Bar graphs show mean ± SEM (n = 9 per group, unpaired 2-tailed Student t test).

