Figure 4.
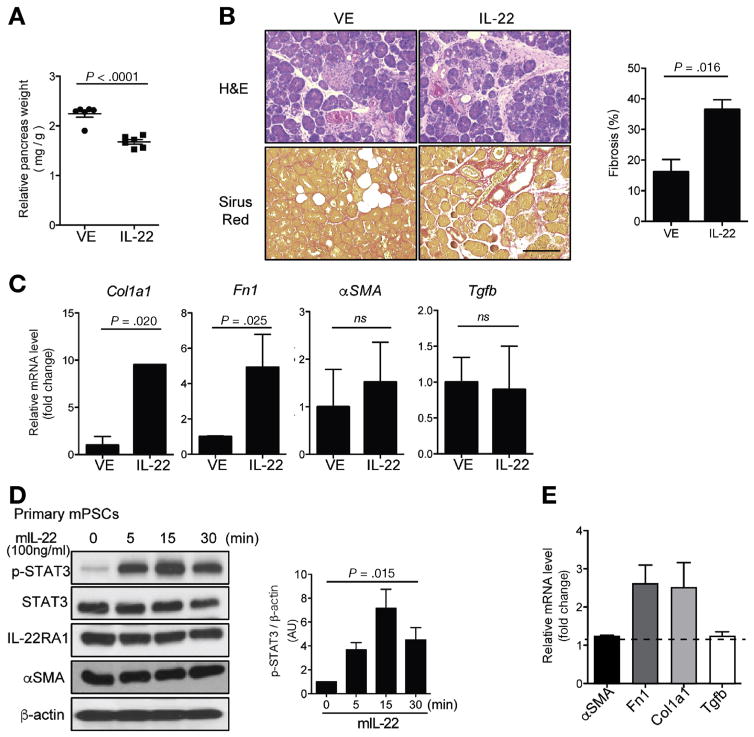
IL22 promotes pancreatic fibrosis via up-regulation of PSC ECM gene expression. Vehicle (VE) or rIL22 (100 ng/mouse, 5 times per week) was administrated to Balb/c mice starting at 4 weeks of CP induction and mice were euthanized after 6 weeks of caerulein injection. (A) Relative pancreas weight from VE- and IL22-treated mice is shown (n = 6 per group pooled from 2 independent experiments, mean ± SEM, unpaired 2-tailed Student t test). (B) Representative of pancreas H&E and Sirus Red staining. Scale bar = 200 μm. Quantitated fibrotic areas are shown in bar graph (mean ± SEM). (C) Quantitative reverse transcription polymerase chain reaction (RT-PCR) analysis of Col1α1 (collagen 1A1), Fn1 (fibronectin), αSMA (α-SMA), and Tgfb (TGFβ) expression in the pancreas from indicated mice. Bar graphs show mean ± SEM (n = 6, unpaired 2-tailed Student t test). (D) Primary murine PSCs (mPSCs) were treated with rIL22 (100 ng/mL) for indicated times and then lysed for immunoblotting with phosphorylated STAT3 (p-STAT), total STAT3, IL22RA1, and α-SMA. Data are representative of 3 independent experiments. Relative phosphorylated STAT3 levels (p-STAT3/β-actin) are shown as bar graph (mean ± SEM, one-way analysis of variance). (E) mPSCs were treated with VE or rIL22 (100 ng/mL) for 24 hours, expression of αSMA (α-SMA), Col1α1 (collagen 1A1), Fn1 (fibronectin), and Tgfb (TGFβ) were detected with quantitative RT-PCR. Results are shown as fold-change relative to VE group. Bar graph represents mean ± SEM (n = 3 independent experiments).

