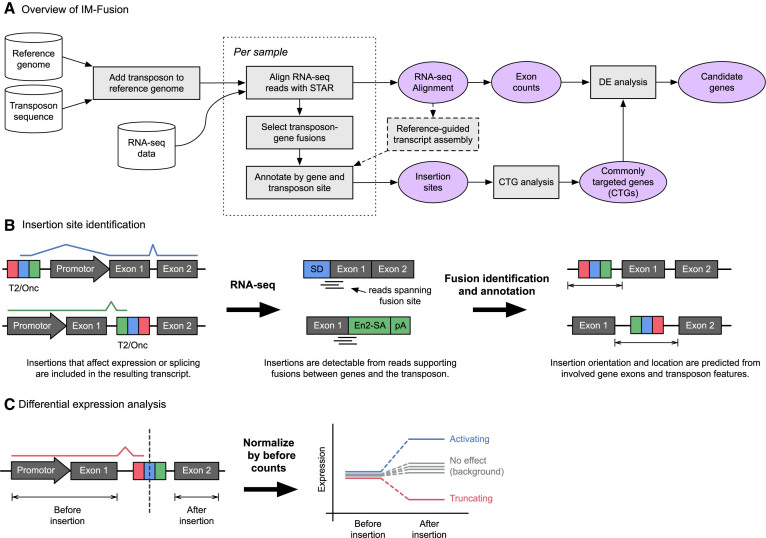
Figure 2.
Overview of IM-Fusion. (A) The IM-Fusion pipeline. Samples are initially processed individually to identify insertions and generate gene and exon expression counts for each sample separately. The per-sample results are then combined to identify genes that are recurrently affected across samples. For these genes, we then combine the expression and insertion data to test for differential expression over the insertion site. The results of this analysis are used to determine if insertions have a significant effect on the expression of their target genes and exactly how the insertions affect the resulting gene transcript. (B) Transposons that affect gene expression are included in gene transcripts and are therefore detectable as fusion transcripts between genes and the transposon. These fusions are detected by reads or mate-pairs that bridge the fusion site. The breakpoints of the identified gene-transposon fusions are analyzed to identify the involved gene(s) and predict an approximate location for the corresponding insertion(s). (C) Insertion and expression data are combined to test if an insertion significantly affects the expression of exons downstream of the insertion site. Expression counts are calculated both before/after the insertion site for a sample with an insertion and a set of background samples without an insertion. The ‘before’ count is then used to normalize the sample counts, after which the normalized ‘after’ counts are compared to the ‘before’ counts to test for differential expression. Samples with a truncating insertion are expected to show a lower level of expression after the insertion relative to the background, whilst samples with an activating insertion are expected to show increased expression after the insertion.

