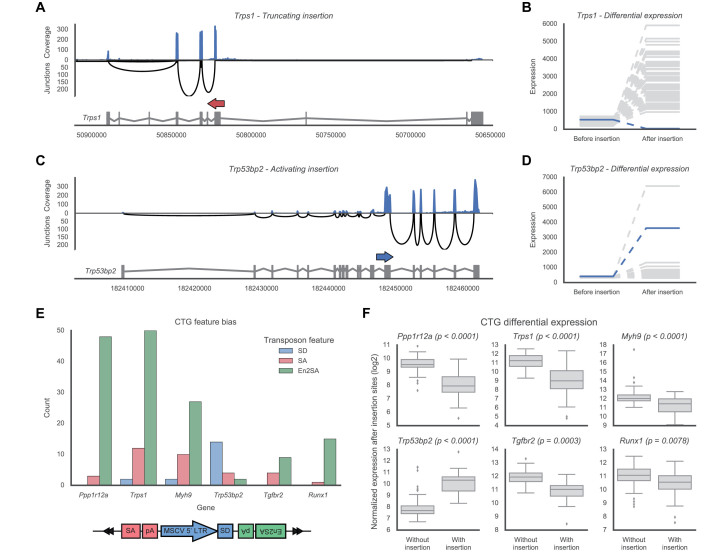
Figure 3.
Examples of identified insertions, CTGs and their effect on gene expression. (A) An example of an antisense insertion in Trps1 that results in truncation of the gene transcript. The insertion (red arrow) is shown above the main transcript of the gene, together with expression levels of the gene. The expression of the exons is shown along the top in blue, which reflects the number of reads covering the various exons. Similarly, the black arches below indicate the strength of the splicing junctions between the different exons, with the height of the arch indicating the number of reads supporting the splice junction. Taken together, these expression profiles show a strong decrease in expression after the insertion site, supporting the hypothesized truncation. (B) Quantified expression levels before/after the insertion site for the Trps1 insertion shown in (A). Compared to the samples without an insertion (gray), the sample with this insertion (blue) shows a significant decrease in expression after the insertion. (C and D) An example of a sense insertion in Trp53bp2 (blue arrow). This insertion results in both truncation of the gene and overexpression of a partial transcript. This overexpression is clearly reflected by the increase in expression after the insertion site. (E) Frequencies of the transposon features involved in the insertions of the top six identified CTGs. A bias toward SA/En2SA favors truncation of the gene, whereas a bias toward SD favors overexpression. (F) Differential expression across the insertion sites for each of the CTGs. An increase in the presence of an insertion indicates overexpression, a decrease indicates truncation.

