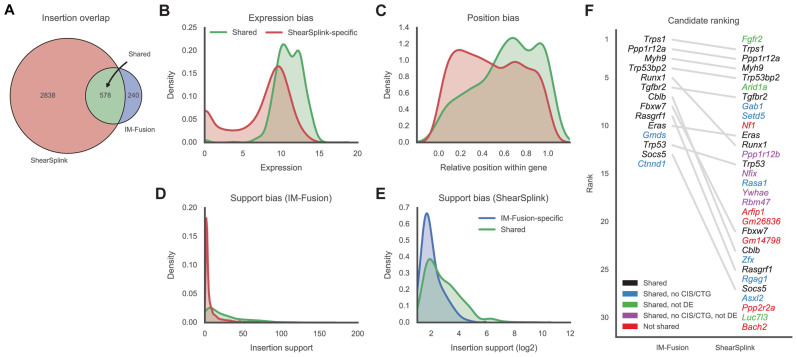
Figure 4.
Comparison of insertions identified by IM-Fusion and ShearSplink. (A) Venn diagram of the insertions identified by ShearSplink (red) and IM-Fusion (blue). Many IM-Fusion insertions are shared with ShearSplink (green), but a considerable number of insertions are unique to either approach. (B and C) Distribution of features reflecting biases of RNA-sequencing that affect the detection of insertions by IM-Fusion. ShearSplink-specific insertions (red) typically have low expression compared to shared insertions (green) and are therefore more difficult to detect by RNA-seq. Similarly, insertions toward the start of the gene are more frequently missed by IM-Fusion due to the 3΄ bias of the polyA tail selection used in the RNA-sequencing. (D and E) Distributions of support of DNA-seq insertions and support of RNA-seq insertions. Insertions with low DNA-seq support are more often missed by IM-Fusion, whilst insertions with low IM-Fusion support are often not detected by ShearSplink. These differences likely reflect heterogeneity of subclonal insertions present in the tumor tissue samples used for DNA-seq and RNA-seq, respectively. (F) Comparison of the frequency-based ranking of candidate genes identified by IM-Fusion and ShearSplink. Gray lines indicate the relative rankings of genes that were identified by both approaches. Genes missed by the other approach are marked red. Genes that were identified to have insertions but not selected as CISs/CTGs by the other approach are colored blue or purple, depending on their differential expression status. Genes that were identified as CISs/CTGs but were not differentially expressed are marked green.

