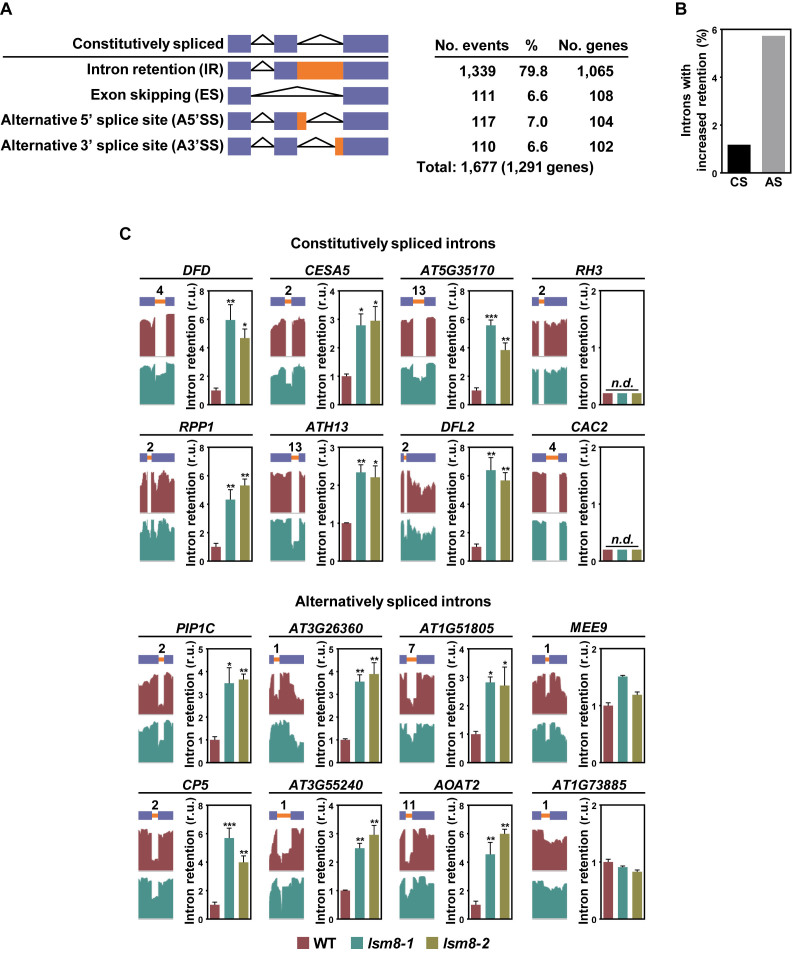
Figure 1.
The LSM2–8 complex controls constitutive and alternative splicing in Arabidopsis. (A) Quantification of altered splicing events (IR, ES, A5΄SS, A3΄SS) identified in lsm8-1 respect to WT plants under control conditions. Blue bars represent exons. Orange bars represent intron regions retained in some events. The total number of different genes affected by the ensemble of altered splicing events identified is shown in parentheses. (B) Percentage of constitutively (CS) and alternatively spliced (AS) introns with increased retention in lsm8-1 plants relative to the total number of the corresponding introns identified in WT plants. (C) Different IR events identified in lsm8-1 plants. For each event, the name of the gene containing the corresponding constitutively or alternatively spliced intron is indicated. A diagram of the pre-mRNA regions, including the retained introns (orange bars) with their relative positions in the representative gene model and the flanking exons (blue bars), together with the captures of the corresponding read coverage tracks obtained from the IGV software is shown in the left. The quantification of retained introns in WT, lsm8-1 and lsm8-2 plants by qPCR assays is displayed in the right. Bars indicate the standard error of the mean (n = 3). Asterisks (*) indicate significant differences (*P ≤ 0.01, **P ≤ 0.001, ***P ≤ 0.0001) between lsm8 mutants and WT plants, as determined by ANOVA-test. n.d. indicates non-detected events by qPCR.

