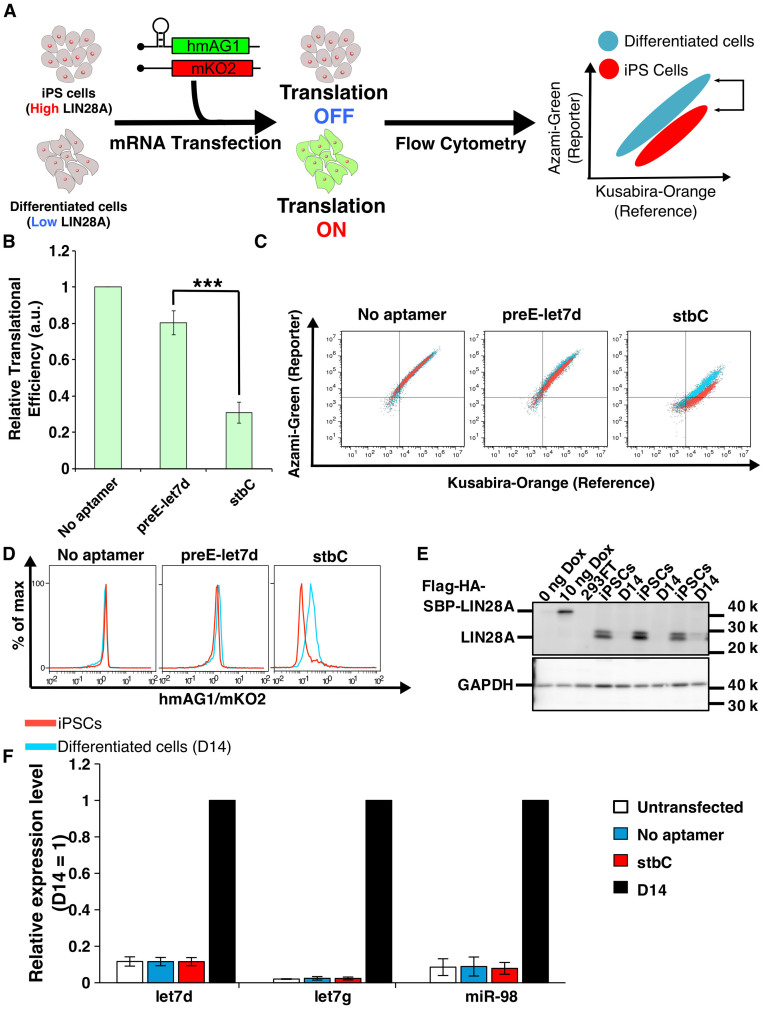
Figure 7.
Distinction of living cell types using LIN28A-responsive mRNA devices. (A) Distinction of human iPSCs with differentiated cells by detecting endogenous LIN28A expression level. LIN28A is highly expressed in iPSCs, and its expression level is decreased after differentiation. LIN28A in iPSCs reduces the translation level from LIN28A-responsive hmAG1 mRNA. In differentiated cells, LIN28A expression level is low, resulting in normal translation (left and middle panels). After co-transfection of the LIN28A-responsive hmAG1 mRNA and reference mRNA encoding mKO2, the cells typically show belt-like distribution in a two-dimensional plot by flow cytometry analysis (right panel). A shift of the population is observed as the result of translational repression of hmAG1 in iPSCs but not in differentiated cells, resulting in the separation of iPSCs from differentiated cells based on LIN28A detection. (B) Relative translational efficiency of transfected mRNAs in iPSCs and D14. Relative translational efficiency = (N.I. of iPSCs)/(N.I. of D14) (See ‘Flow cytometry data analysis’ in ‘Materials and Methods’ section). Error bars represent mean ± SD (n = 3 independent experiments, each performed in duplicate). ***P < 0.0005 (Welch's t-test). (C) Representative overlaid dot plots of iPSCs (red) and differentiated cells (D14, blue). (D) Representative histograms related to Figure 7C. Red, hiPSCs; blue, D14. (E) Western blot analysis of the LIN28A expression. A total of 0 ng Dox, 10 ng Dox and 293FT were applied as controls, and GAPDH was used as internal control. The samples used in these experiments were also used for the data in Figure 5C. iPSCs and D14 samples were collected in different experiments. LIN28A was detected by anti-LIN28A. (F) Endogenous miRNA expression levels by LIN28A-responsive mRNA transfection. Mature let7d, let7g and miR-98 levels were analyzed by qRT-PCR. We used differentiated cells (D14, black bar) as a control, because the expression levels of these miRNAs increased in differentiated cells compared with iPSCs. Thus, the expression levels of miRNAs in untransfected (white), mRNA (without aptamer)-transfected (blue) and stbC-containing mRNA-transfected (red) iPSCs were normalized by the expression level of the miRNAs in D14. Error bars indicate SD for three independent experiments. Significant differences were not observed among untransfected, no aptamer and stbC.

