Figure 1.
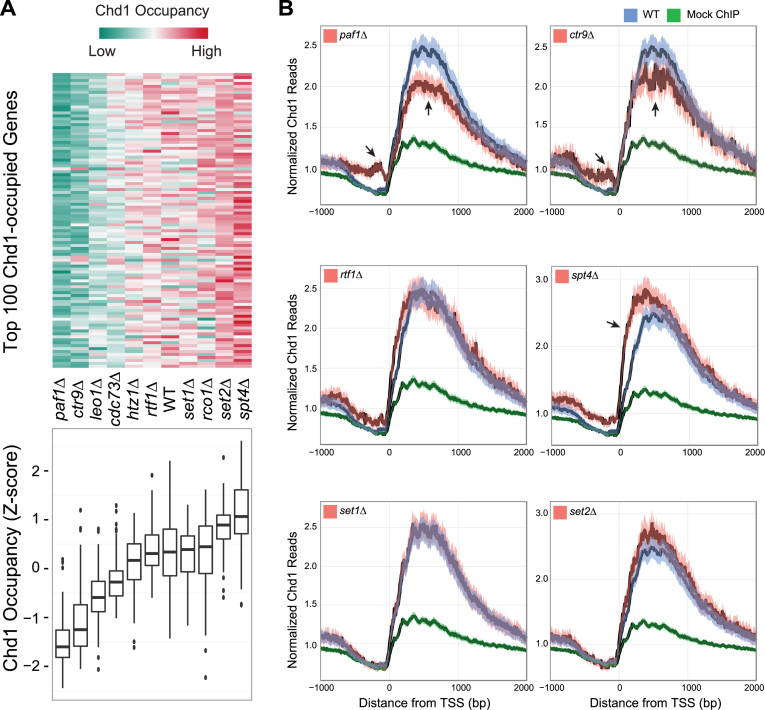
Chd1 occupancy in the wild-type (WT) strain and deletion mutants of candidate recruitment factors. (A) Top: the heat map shows Chd1 occupancy in the indicated deletion mutants at the 100 genes where Chd1 occupancy was highest in WT cells. Each row indicates a gene. Chd1 occupancy was measured by counting Chd1 Chromatin immunoprecipitation sequencing (ChIP-seq) reads from the transcription start site (TSS) to transcription termination site (TTS) and normalizing by transcript length and sequencing depth. The level of occupancy of Chd1 is depicted in a green-to-red color scheme (green—low; red—high occupancy of Chd1) after being standardized into a z-score per row. Bottom: boxplots summarize the distribution of Chd1 occupancy values shown above. (B) Metagene average occupancy profiles of Chd1 in candidate recruitment factor deletions. The y-axis in the plots shows normalized Chd1 ChIP-seq read density (reads per million, RPM) obtained by averaging the read counts for the most actively transcribed genes, identified based on the occupancy of RNAPII Ser-5P in the WT strain under normal growth conditions (536 genes, see ‘Materials and Methods’ section). The x-axis shows the distance from 1 kb upstream to 2 kb downstream of the TSS. Each plot includes a positive control (Chd1 occupancy measured in the WT strain, blue) and a negative control (a mock ChIP, green) to compare Chd1 occupancy in the selected deletion mutants (red). The dark line is the mean and the shaded envelope indicates the 95% confidence interval for the mean Chd1 ChIP-seq read density.PAF1, CTR1 and SPT4 mutants show a highly significant difference in Chd1 occupancy. The arrows indicate the genomic regions showing the strongest and most significant differences in occupancy. RTF1, SET1 and SET2 mutants show a marginal difference in Chd1 occupancy.

