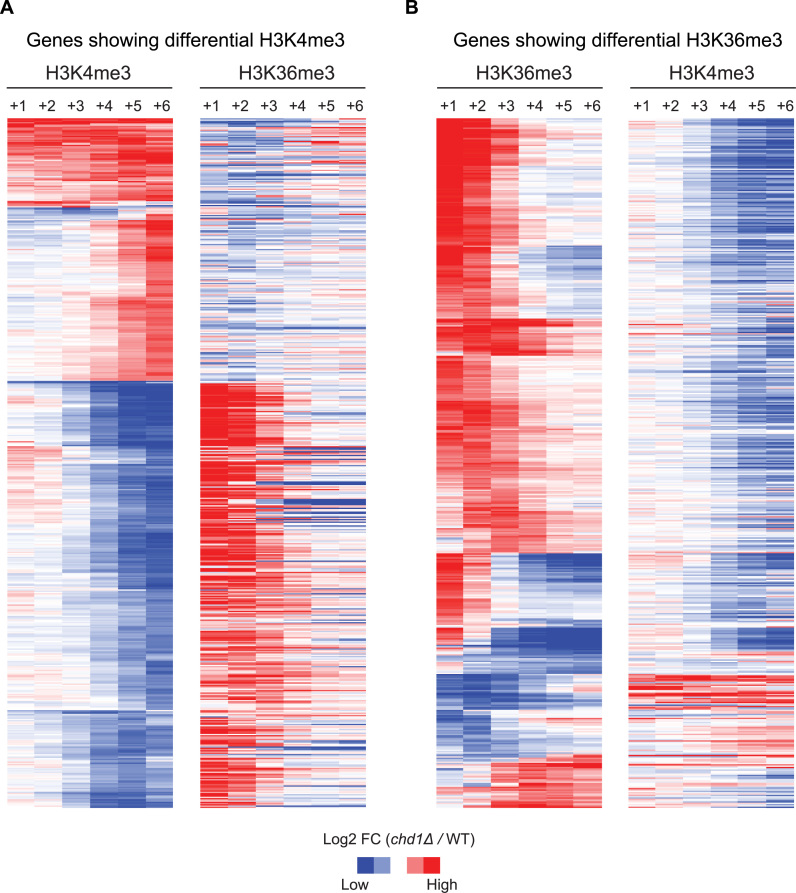
Figure 3.
A reciprocal change between H3K4me3 and H3K36me3 upon loss of CHD1. (A) Genes showing differential H3K4me3 in chd1Δ. Hierarchical clustering was performed on the H3K4me3 data (left) and the corresponding H3K36me3 data was plotted on the right to reveal the relationship between these two methylation marks. Each column in the heat maps indicates nucleosome positions from +1 to +6. Fold-change of H3 tri-methylation in chd1Δ over WT were transformed into a log2-scale and depicted in a blue-to-red color scheme (blue—less H3 tri-methylation in chd1Δ; red—more H3 tri-methylation in chd1Δ, when compared to WT). (B) Genes showing differential H3K36me3 in chd1Δ. Hierarchical clustering was performed on the H3K36me3 data (left) and the corresponding H3K4me3 data (right) was plotted on the right.

