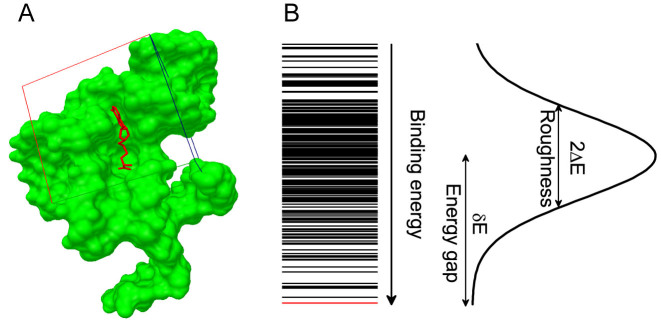
Figure 1.
Quantification of binding specificity. (A) Representative nucleic acid–ligand binding complex (PDB ID: 3NPN) with the RNA structure shown in molecular surface and the ligand shown in sticks, the native pose of the ligand is colored in red and the conformation ensemble is distributed within the docking box covering the binding pocket as well as its surrounding surface. (B) Binding energy spectrum for the conformation ensemble, the line for native conformation is colored in red. The binding energy of the conformation ensemble follow a statistical Gaussian-like distribution, from which the binding specificity is quantified with the dimensionless intrinsic specificity ratio (ISR) by  (18,21,23,27). The energy gap (δE) is computed with <E > −EN and the energy fluctuation or roughness (ΔE) is computed with
  , EN is the binding energy of the native conformation and S is the conformational entropy of the ligand.

