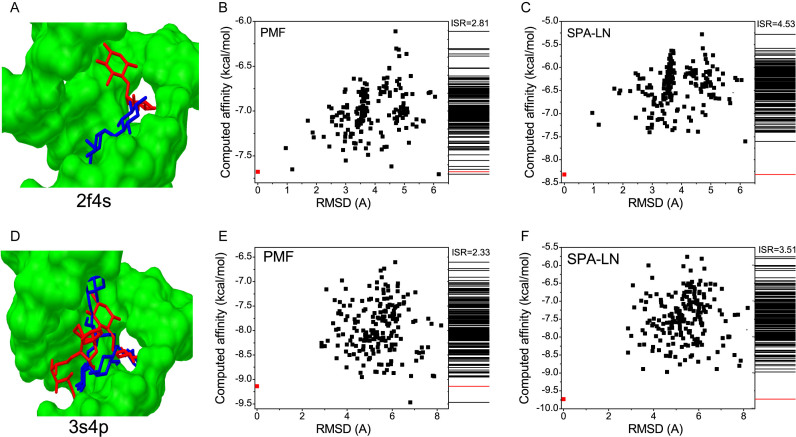
Figure 4.
Performance improvement of SPA-LN over PMF. (A and D) The structure of the ligand binding onto the pocket of nucleic acid, the nucleic acid in green is shown in molecular surface, the pose of the ligand is shown in sticks. The pose (native pose) in red is predicted by SPA-LN and the the pose in blue is predicted by PMF. (B and E) Energy-conformation relation and the spectrum of binding affinities for the conformation ensemble computed by PMF, the native pose is colored in red. (C and F) Energy-conformation relation and the spectrum of binding affinities for the conformation ensemble computed by SPA-LN, the native pose is colored in red.

