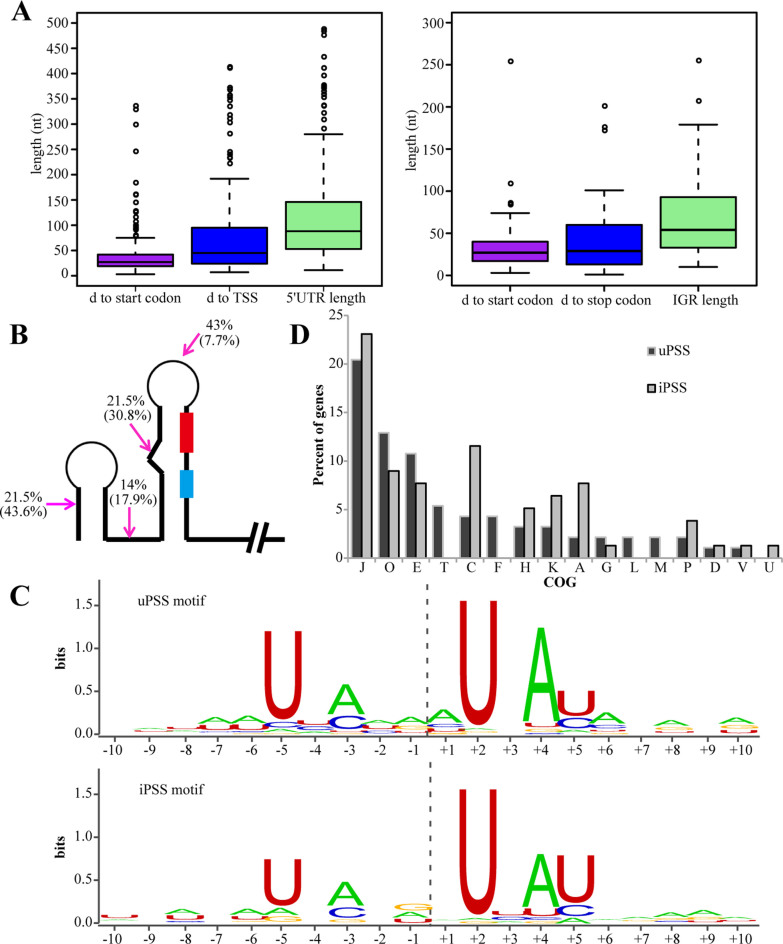
Figure 2.
Characteristic patterns of the processing sites and functional enrichment of PSS-associated genes in R15. (A) Boxplots show distance (d) distribution of uPSSs to their TSS/start codon and the 5΄ UTR lengths (left), and iPSSs to the downstream start codon/upstream stop codon and the IGR length (right). (B) A diagram shows the location distribution percentage of uPSS in 5΄ UTR and iPSS within IGR shown inside the parentheses. PSS (magenta arrow), RBS (red box) and translation start codon (light blue box) are shown. (C) The processing motif of uPSS and iPSS based on alignment of sequence around processing sites. Positions on the x-axis are relative to the PSS. (D) Distribution of uPSS- and iPSS-associated genes amongst different COGs. Note that the majority of uPSS- and iPSS-associated genes belong to four COGs: J, O, E and C.

