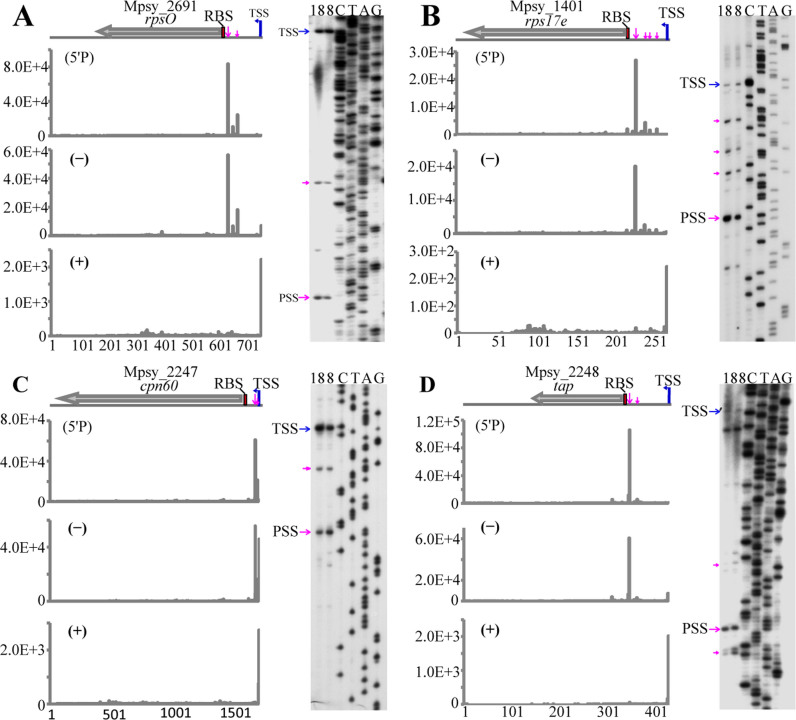
Figure 3.
Primer extension analysis of uPSS-mediated transcripts of ribosomal protein genes rpsO (A) and rps17e (B), and thermosome-related genes cpn60 (C) and tap (D). Blue and magenta arrows indicate TSSs and PSSs, respectively. RBSs are shadowed by red box. Sequencing reads of the TSS in (+) library, both TSS and PSS in (−) library and PSS only in (5΄P) library are shown in the left panels. The y-axis scale represents the read count of a given site. Primer extension gels are shown in the right panels. The numbers 18 and 8 on the gel top indicate RNA isolated from R15 cultures grown at 18°C and 8°C, respectively.

